Volume 11, Number 1—January 2005
Research
Hybrid Vibrio vulnificus
Naiel Bisharat* , Daniel I. Cohen†, Rosalind M. Harding*, Daniel Falush*, Derrick W. Crook*, Tim Peto*, and Martin C. Maiden*
Figure 1
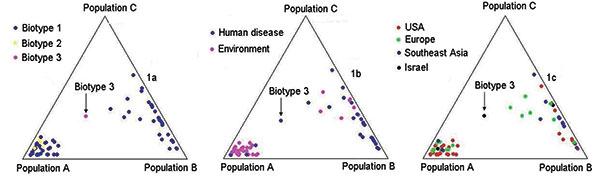
Figure 1. Triangle plots of STRUCTURE results. Only 2 populations were identified (A and B). shows the distribution of the biotypes within the 2 populations. B shows the distribution of the strains according to their source (human or environmental). C shows the strains distribution according to their geographic origin. These results were produced by the linkage model of STRUCTURE with K = 3.
Page created: April 14, 2011
Page updated: April 14, 2011
Page reviewed: April 14, 2011
The conclusions, findings, and opinions expressed by authors contributing to this journal do not necessarily reflect the official position of the U.S. Department of Health and Human Services, the Public Health Service, the Centers for Disease Control and Prevention, or the authors' affiliated institutions. Use of trade names is for identification only and does not imply endorsement by any of the groups named above.