Volume 11, Number 1—January 2005
Research
Hybrid Vibrio vulnificus
Naiel Bisharat* , Daniel I. Cohen†, Rosalind M. Harding*, Daniel Falush*, Derrick W. Crook*, Tim Peto*, and Martin C. Maiden*
Figure 2
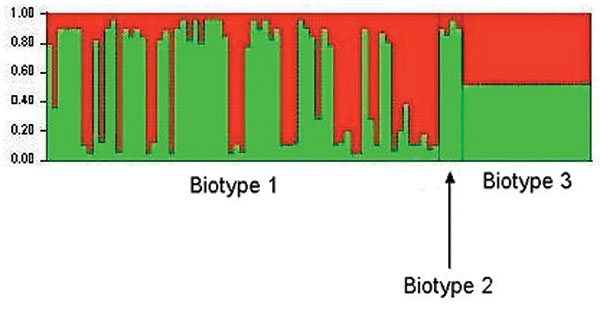
Figure 2. Results of a Bayesian cluster analysis by STRUCTURE. Each of the strains included in the analysis is represented by a thin vertical line, partitioned into 2 colored segments that represent the proportion of polymorphic sites inherited from each of the 2 genetic ancestries. For the representation of results, strains were grouped according to biotype. The analysis was carried out by using the linkage model with K = 2.
Page created: April 14, 2011
Page updated: April 14, 2011
Page reviewed: April 14, 2011
The conclusions, findings, and opinions expressed by authors contributing to this journal do not necessarily reflect the official position of the U.S. Department of Health and Human Services, the Public Health Service, the Centers for Disease Control and Prevention, or the authors' affiliated institutions. Use of trade names is for identification only and does not imply endorsement by any of the groups named above.