Volume 14, Number 3—March 2008
Research
Chikungunya Fever in Travelers Returning to Europe from the Indian Ocean Region, 2006
Figure 2
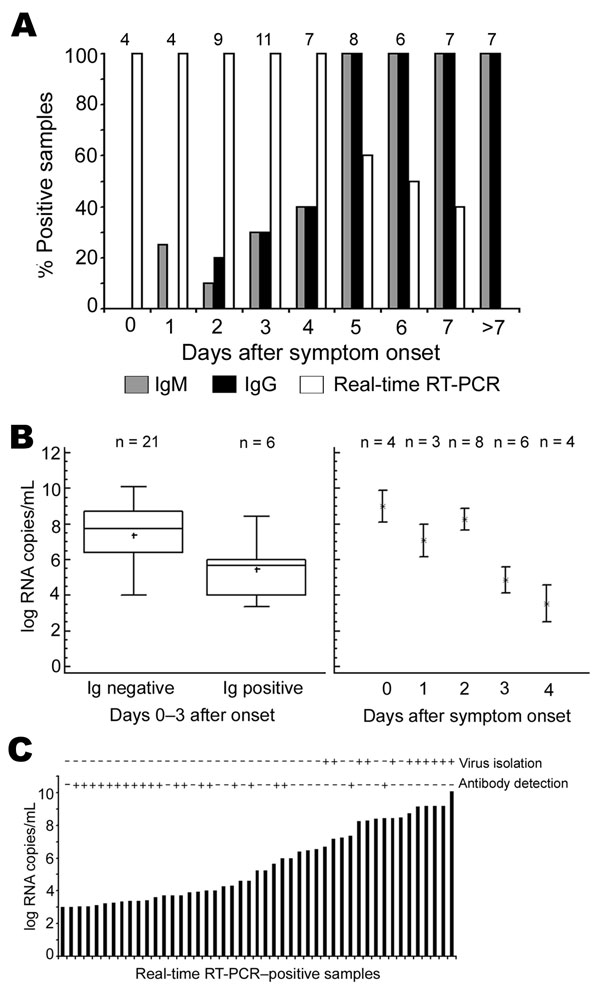
Figure 2. A) Rates of positive results from assays for immunoglobulin (Ig) M, IgG, and virus RNA, first 10 days of symptoms. Numbers above bars are numbers of samples (and patients). B) Left panel, viral loads in serum or plasma in antibody-negative, PCR-positive patients (n = 21, left column) and in antibody-positive, PCR-positive patients (n = 6, right column). All patients were sampled during first 3 days of symptoms. Right panel, viral loads in all antibody-negative, PCR-positive samples. Error bars represent interquartile ranges. C) Viral loads, antibodies, and virus isolation from 47 samples positive by reverse transcription–PCR (RT-PCR). Virus isolation + indicates isolation success as confirmed by cytopathogenic effect and direct immunofluorescence assay. Antibody detection + indicates an IgG or IgM titer >10 by immunofluorescence assay.