Volume 14, Number 6—June 2008
Dispatch
Spatial and Temporal Evolution of Bluetongue Virus in Wild Ruminants, Spain
Francisco Ruiz-Fons*† , Álvaro R. Reyes-García*, Vicente Alcaide‡, and Christian Gortázar*
Figure 2
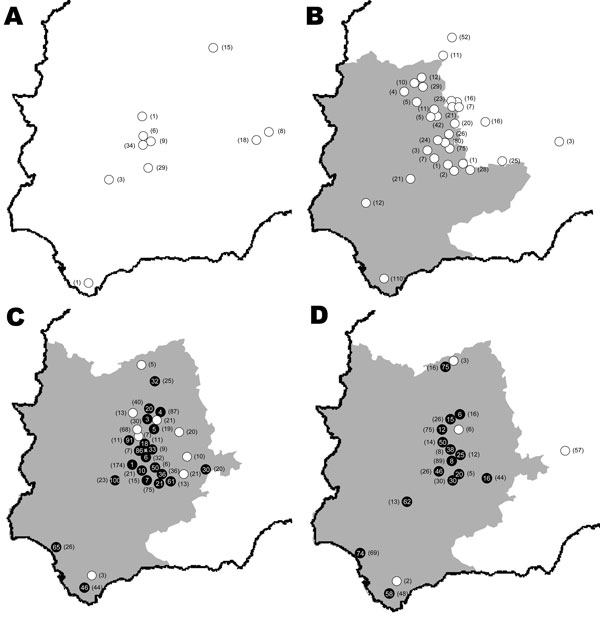
Figure 2. Study areas in Spain showing wild ruminant sampling sites by study year. A) 2003–2004; B) 2004–2005; C) 2005–2006; D) 2006–2007. A year is defined as the period July–June. Animal movement restriction areas for each year (www.mapa.es) are shown (gray areas). White dots show wild ruminant seronegative sampling sites, and black dots show level of bluetongue virus seroprevalence in wild ruminants. Numbers of sampled wild animals per sampling site are shown in parentheses.
Page created: July 09, 2010
Page updated: July 09, 2010
Page reviewed: July 09, 2010
The conclusions, findings, and opinions expressed by authors contributing to this journal do not necessarily reflect the official position of the U.S. Department of Health and Human Services, the Public Health Service, the Centers for Disease Control and Prevention, or the authors' affiliated institutions. Use of trade names is for identification only and does not imply endorsement by any of the groups named above.