Volume 8, Number 6—June 2002
Perspective
Clinical Epidemiology of Malaria in the Highlands of Western Kenya
Figure 1

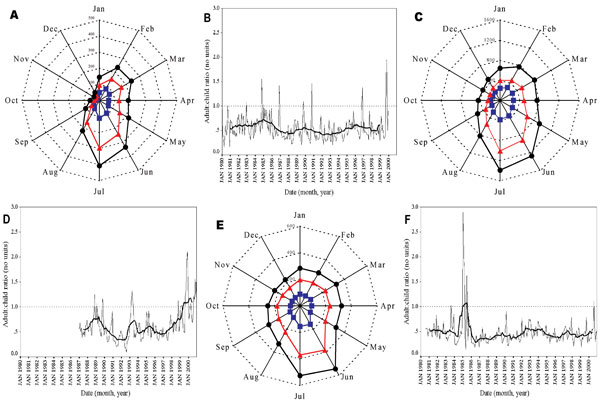
Figure 1. Spider plots of adult, child, and total admissions and time series of adult:child ratio for three study hospitals in Kenya. Spider plots of malaria admissions in Kilgoris (a), Kisii (c), and Tabaka (e). The data are monthly averages for the 1980–1999, 1987–2000, and 1981–2000 time periods, respectively. Adult cases (>15 years of age) are shown in blue, child cases (<15 years) are shown in red, and total cases in black. Time series plots of the monthly adult:child ratio data are also shown for Kilgoris (b), Kisii (d), and Tabaka (f) as the continuous black line. The dashed line represents the value of 1 where adult and child admissions are equal, as is to be expected in true epidemic conditions (39–41). The bold line is a 25-point (month) moving average of the adult:child ratio.