Volume 9, Number 4—April 2003
Research
Infectious Pancreatic Necrosis Virus in Scottish Atlantic Salmon Farms, 1996–2001
Alexander G. Murray*† , Corina D. Busby*, and David W. Bruno*
Figure 4
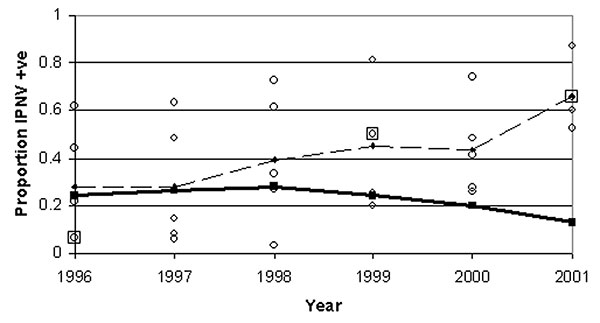
Figure 4. Mean of regional annual mean prevalence of infectious pancreatic necrosis virus in marine salmon farms (thin dashed line) and standard deviation of regional annual means (thick solid line), by year. Individual marine regional annual means are shown by circles (where two circles overlay, a large square is added). Standard deviation has fallen at an increasing rate, in spite of increasing mean regional prevalence.
Page created: December 08, 2010
Page updated: December 08, 2010
Page reviewed: December 08, 2010
The conclusions, findings, and opinions expressed by authors contributing to this journal do not necessarily reflect the official position of the U.S. Department of Health and Human Services, the Public Health Service, the Centers for Disease Control and Prevention, or the authors' affiliated institutions. Use of trade names is for identification only and does not imply endorsement by any of the groups named above.