Skip directly to site content Skip directly to page options Skip directly to A-Z link Skip directly to A-Z link Skip directly to A-Z link
Volume 9, Number 6—June 2003
Research

Molecular Subtyping To Detect Human Listeriosis Clusters

Brian D. Sauders*†, Esther D. Fortes†, Dale L. Morse*‡, Nellie Dumas*, Julia A. Kiehlbauch*, Ynte Schukken†, Jonathan R. Hibbs*, and Martin Wiedmann†Comments to Author 
Author affiliations: Wadsworth Center, New York State Department of Health, Albany, New York, USA*; Cornell University, Ithaca, New York, USA†; University at Albany, Albany, New York, USA‡

Main Article

Figure 2

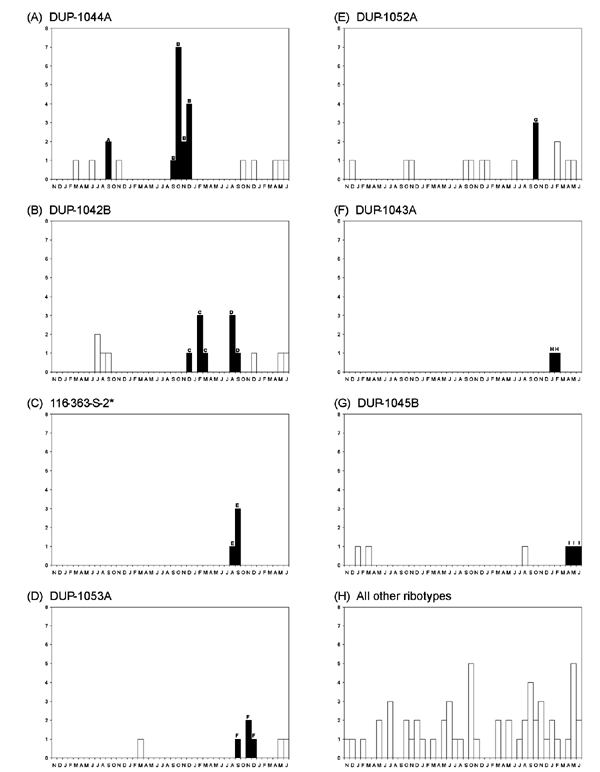
Temporal distribution of listeriosis clusters detected based on ribotype or pulsed-field gel electrophoresis (PFGE) data, using a 3-month window scan statistic. Panels A–G each show the distribution of cases caused by a specific ribotype; ribotypes are denoted in the header of each panel. For panel C, one case caused by ribotype DUP-1044B is included with cases caused by ribotype 116-363-S-2 based on a PFGE match (Table 1, cluster E). Cases, which are part of statistically significant ribotype or PFGE clusters, are denoted by dark bars and labeled by cluster designation (A–I, see Table 1). Open bars indicate cases that were not part of a cluster detected by the scan statistics. Panel H shows human cases, which did not represent clusters and were not caused by any of the ribotypes shown in panels A–G. The X-axis of each panel represents November 1996 to June 2000.

Figure 2. Temporal distribution of listeriosis clusters detected based on ribotype or pulsed-field gel electrophoresis (PFGE) data, using a 3-month window scan statistic. Panels A–G each show the distribution of cases caused by a specific ribotype; ribotypes are denoted in the header of each panel. For panel C, one case caused by ribotype DUP-1044B is included with cases caused by ribotype 116-363-S-2 based on a PFGE match ([[ANCHOR###T1###Table 1###Anchor]], cluster E). Cases, which are part of statistically significant ribotype or PFGE clusters, are denoted by dark bars and labeled by cluster designation (A–I, see [[ANCHOR###T1###Table 1###Anchor]]). Open bars indicate cases that were not part of a cluster detected by the scan statistics. Panel H shows human cases, which did not represent clusters and were not caused by any of the ribotypes shown in panels A–G. The X-axis of each panel represents November 1996 to June 2000.

Main Article

Page created: October 07, 2024
Page updated: October 07, 2024
Page reviewed: October 07, 2024
The conclusions, findings, and opinions expressed by authors contributing to this journal do not necessarily reflect the official position of the U.S. Department of Health and Human Services, the Public Health Service, the Centers for Disease Control and Prevention, or the authors' affiliated institutions. Use of trade names is for identification only and does not imply endorsement by any of the groups named above.
file_external