Volume 11, Number 12—December 2005
Dispatch
Phocine Distemper Outbreak, the Netherlands, 2002
Jolianne M. Rijks*†‡, Marco W.G. Van de Bildt‡, Trine H. Jensen§, Joost D.W. Philippa‡, Albert D.M.E. Osterhaus*†‡, and Thijs Kuiken*†‡
Figure 1
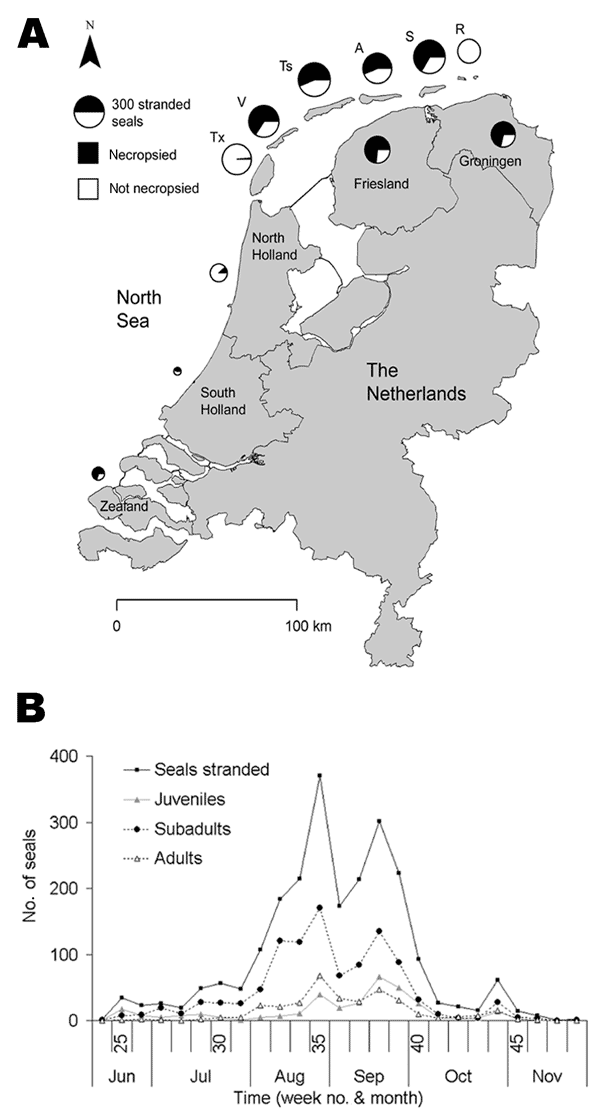
Figure 1. Spatial and temporal distribution of seal strandings in the Netherlands during the 2002 phocine distemper virus epidemic. A) Spatial distribution of seal strandings and proportion of seals necropsied at each location. The diameter of each pie chart corresponds to the number of seals stranded at a particular location. The names of the Wadden Sea islands have been abbreviated (Tx, Texel; V, Vlieland; Ts, Terschelling; A, Ameland; S, Schiermonnikoog; R, Rottumeroog and Rottumerplaat). B) Weekly stranding rate of all stranded harbor seals and effect of age category on weekly stranding rate.
Page created: February 02, 2012
Page updated: February 02, 2012
Page reviewed: February 02, 2012
The conclusions, findings, and opinions expressed by authors contributing to this journal do not necessarily reflect the official position of the U.S. Department of Health and Human Services, the Public Health Service, the Centers for Disease Control and Prevention, or the authors' affiliated institutions. Use of trade names is for identification only and does not imply endorsement by any of the groups named above.