Volume 11, Number 12—December 2005
Research
Intergenogroup Recombination in Sapoviruses
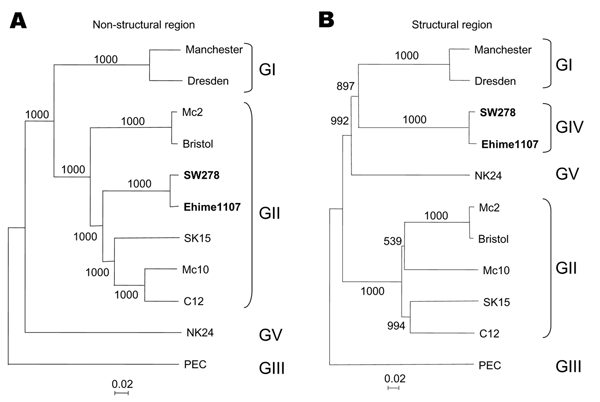
Figure 1

Figure 1. Phylogenetic analysis of (A) the nonstructural region (i.e., genome start to capsid start) and (B) the structural region (i.e., capsid start to genome end), showing the different genogroups. The numbers on each branch indicate the bootstrap values for the genotype. Bootstrap values >950 were considered significant for the grouping (10). The scale represents nucleotide substitutions per site. GenBank accession numbers are as follows: Mc10, AY237420; Manchester, X86560; Dresden, AY694184; SW278, DQ125333; Ehime1107, DQ058829; NK24, AY646856; C12, AY603425; Bristol, AJ249939; Mc2, AY237419; PEC, AF182760; and SK15, AY646855.
Page created: February 02, 2012
Page updated: February 02, 2012
Page reviewed: February 02, 2012
The conclusions, findings, and opinions expressed by authors contributing to this journal do not necessarily reflect the official position of the U.S. Department of Health and Human Services, the Public Health Service, the Centers for Disease Control and Prevention, or the authors' affiliated institutions. Use of trade names is for identification only and does not imply endorsement by any of the groups named above.