Volume 14, Number 12—December 2008
Research
African Swine Fever Virus Isolate, Georgia, 2007
Rebecca J. Rowlands, Vincent Michaud, Livio Heath, Geoff Hutchings, Chris Oura, Wilna Vosloo, Rahana Dwarka, Tinatin Onashvili, Emmanuel Albina, and Linda K. Dixon
Figure
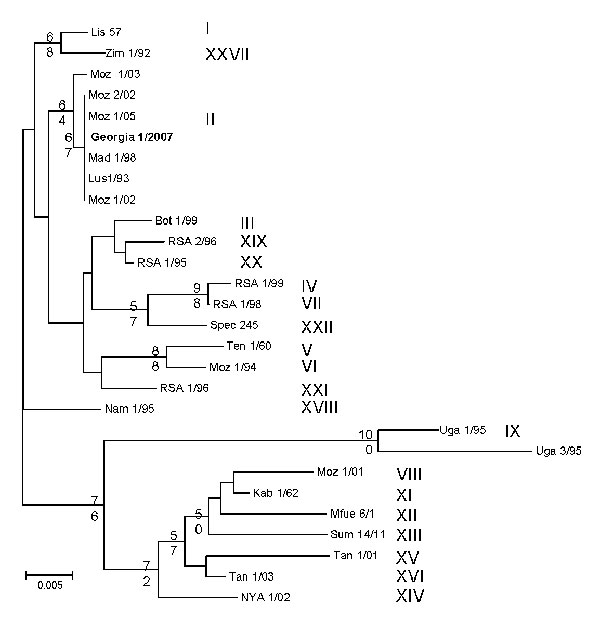
Figure. Phylogram depicting the B646L gene relationships of selected isolates representative of the 22 African swine fever virus genotypes. Because all the Georgian isolates had identical nucleotide sequences, only 1 isolate is presented in the tree (in boldface). The consensus tree was generated from 1,000 replicates; only bootstraps >50% are shown. Genotypes are indicated in roman numerals. Moz, Mozambique. Scale bar indicates number of nucleotide substitutions per site.
Page created: July 22, 2010
Page updated: July 22, 2010
Page reviewed: July 22, 2010
The conclusions, findings, and opinions expressed by authors contributing to this journal do not necessarily reflect the official position of the U.S. Department of Health and Human Services, the Public Health Service, the Centers for Disease Control and Prevention, or the authors' affiliated institutions. Use of trade names is for identification only and does not imply endorsement by any of the groups named above.