Skip directly to site content Skip directly to page options Skip directly to A-Z link Skip directly to A-Z link Skip directly to A-Z link
Volume 17, Number 12—December 2011
Dispatch

Fatal Outbreak of Mycoplasma capricolum Pneumonia in Endangered Markhors

Stéphane OstrowskiComments to Author , Francois Thiaucourt, Mulojon Amirbekov, Abdurahmon Mahmadshoev, Lucía Manso-Silván, Virginie Dupuy, Dustmurod Vahobov, Orom Ziyoev, and Stefan Michel
Author affiliations: Wildlife Conservation Society, New York, New York, USA (S. Ostrowski); Centre de Cooperation International en Recherche Agronomique pour le Développement, Montpellier, France (F. Thiaucourt, L. Manso-Silván, V. Dupuy); Ministry of Agriculture, Dushanbe, Tajikistan (M. Amirbekov, A. Mahmadshoev, O. Ziyoev); Academy of Agricultural Sciences, Dushanbe (D. Vahobov); Nature Protection Team, Dushanbe and Khorog, Tajikistan (S. Michel)

Main Article

Figure 2

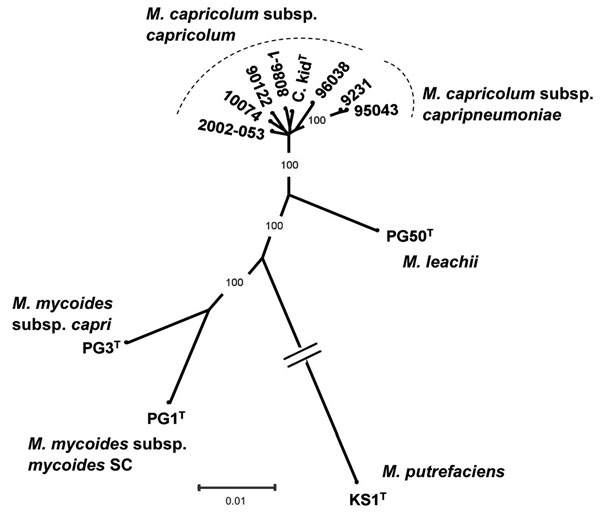
Phylogenetic tree of the Mycoplasma mycoides cluster, including the isolate from markhor (Capra falconeri) 10074 (1.4) in Tajikistan, 2010, together with available M. capricolum subsp. capricolum strains, as well as type strains corresponding to other species or subspecies from this cluster and M. putrefaciens, used as outgroup. The tree, derived from distance analysis of 5 concatenated protein-coding sequences (fusA, glpQ, gyrB, lepA, rpoB), was constructed by using the neighbor-joining algorit

Figure 2. Phylogenetic tree of the Mycoplasma mycoides cluster, including the isolate from markhor (Capra falconeri) 10074 (1.4) in Tajikistan, 2010, together with available M. capricolum subsp. capricolum strains, as well as type strains corresponding to other species or subspecies from this cluster and M. putrefaciens, used as outgroup. The tree, derived from distance analysis of 5 concatenated protein-coding sequences (fusA, glpQ, gyrB, lepA, rpoB), was constructed by using the neighbor-joining algorithm. Bootstrap percentage values were calculated from 500 resamplings, and values >90% are indicated. Scale bar indicates distance equivalent to 1 substitution per 100 nt positions. Note that the branch corresponding to the outgroup has been shortened, as indicated by 2 parallel bars.

Main Article

Page created: November 22, 2011
Page updated: November 22, 2011
Page reviewed: November 22, 2011
The conclusions, findings, and opinions expressed by authors contributing to this journal do not necessarily reflect the official position of the U.S. Department of Health and Human Services, the Public Health Service, the Centers for Disease Control and Prevention, or the authors' affiliated institutions. Use of trade names is for identification only and does not imply endorsement by any of the groups named above.
file_external