Volume 17, Number 6—June 2011
Dispatch
Immunologic Changes during Pandemic (H1N1) 2009, China
Abstract
We analyzed changes in immunologic values over time for 28 hospitalized patients with pandemic (H1N1) 2009. Levels of interleukin-6, interferon-γ, and interleukin-10 increased 1 day after illness onset and then decreased to baseline levels. Levels of virus-specific antibody were undetectable 1 day after illness onset and peaked 36 days later.
Pandemic (H1N1) 2009 virus emerged in March 2009 and spread worldwide (1,2). Most patient laboratory data result from samples or information obtained on the day of hospitalization or when the patient was experiencing the acute phase of infection. Changes in laboratory data throughout the disease course have rarely been reported. We retrospectively analyzed immunologic changes for hospitalized patients through the entire course of pandemic (H1N1) 2009. These data may provide a better understanding of disease pathogenesis.
Twenty-eight patients admitted to Beijing 302 Hospital in Beijing, China, were enrolled in this study in September 2009. All patients had mild clinical courses and fulfilled the case definition for pandemic (H1N1) 2009 (3). Median interval from onset of illness to hospitalization was 1 day (range 0–3 days), and median time of hospitalization was 7 days (range 6–14 days). Serum samples were obtained from patients 1 day after illness onset and 4, 14, 36, and 48 days later for cytokine and antibody measurement. Serum samples from 22 healthy persons were used to determine cytokine and antibody baseline levels.
Serum cytokine concentrations were detected by using the BD Cytometric Bead Array Human Cytokine Kit (BD Biosciences, San Jose, CA, USA) and a BD FACSCalibur flow cytometer, according to the manufacturer’s instructions. CD3 T-lymphocyte counts were <690 cells/mm3 in 9 (32.1%) of 28 patients and represented <55% of total lymphocyte counts in 4 (14.3%) patients (Table). CD4 T-lymphocyte counts were <400 cells/mm3 in 13 (46.4%) patients and represented <31% of total lymphocyte counts in 8 (28.6%) patients. CD8 T-lymphocyte counts were <190 cells/mm3 in 3 (10.7%) patients. B-cell counts were <90 cells/mm3 in 1 (3.6%) patient. Natural killer cells represented >27% of lymphocyte counts in 4 (14.3%) patients. Fourteen (50.0%) patients had a CD4:CD8 ratio less than the standard reference ratio of 1.4.
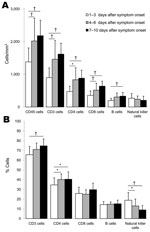
Flow cytometric results showing development of peripheral blood lymphocyte subsets during the disease course were divided into 3 groups on the basis of time of illness onset until date of blood sample collection: 1–3, 4–6, or 7–10 days. These groups were used because the longest time from onset of illness to hospitalization was 3 days for all patients, and the peak temperature for patients was observed 3 days after illness onset.
Mean counts and percentages of all T- and B-lymphocyte subsets increased after 3 days of illness compared with results obtained during the first 3 days of illness (Figure 1). However, the increase in CD8 and B cells was not significant. Another study showed a decrease in CD4, CD8, and B cells ≤2 days of symptom onset in patients with pandemic (H1N1) 2009 than in healthy persons (4). Our results show impaired adaptive immune responses and a gradual increase during recovery in mildly affected patients.
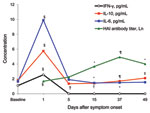
We measured serum cytokine concentrations and hemagglutination inhibition (HAI) antibody titers in patients during hospitalization and the follow-up period (Figure 2). We observed an increase in interleulin-6 (IL-6) levels 1 day after illness onset, which were 6.0-fold higher than the baseline level, and a 2.3-fold increase in interferon-γ (IFN-γ) levels. These levels decreased to baseline levels 5 days after illness onset, although the IL-6 level 5 days after illness onset was higher than levels 15 and 37 days after illness onset. The maximum IL-10 level 1 day after symptom onset was 3.2-fold higher than the baseline level. This level decreased to a value lower than the baseline level within 4 days, and then gradually increased to the baseline level 37 days after illness onset. Serum IL-6, IFN-γ, and IL-10 levels were not related to patient temperature 1 day after symptom onset, peak temperature during the disease, or period of fever. These levels showed minor differences that were not related to cough or sore throat in patients.
Only 1 patient had an HAI antibody titer ≥10 (titer 20) 1 day after illness onset. The HAI geometric mean titer increased 5 days after symptom onset compared with that 1 day after symptom onset and continued to increase until it reached a peak level of 137.9 at 37 days after symptom onset (25.5-fold increase). Peak HAI antibody titers ≥40 and ≥4-fold increases were observed in 27 (96.4%) patients.
Bermejo-Martin et al. reported increased serum levels of IL-6, IFN-γ, and tumor necrosis factor-α in patients with pandemic (H1N1) 2009 during the first 5 days after symptom onset; no difference in levels of these 3 cytokines was observed in patients with mild disease and controls (5). However, similar to another report (4), we detected increases of IL-6 and IFN-γ levels in patients with mild disease during the first 3 days after symptom onset. These different patterns may be caused by different intervals from time of symptom onset to date of sample collection (5 days vs. 3 days) because IL-6 and IFN-γ levels in our study quickly decreased to baseline levels ≤7 days after symptom onset. These results suggest that serum IL-6 and IFN-γ levels may be increased in patients with pandemic (H1N1) 2009 within the first 3 days after symptom onset, followed by a decrease to baseline levels ≤5 days after symptom onset in patients with mild disease or a continuous increase in severely affected patients.
IL-6 and IFN-γ are associated with antiviral immune responses during influenza infection (6–8). However, continuous, excessive release of IL-6 three days after illness onset likely contributed to serious pulmonary inflammation and tissue injury, as has been documented for severe acute respiratory syndrome and 1918 pandemic influenza, but this release could be tempered by production of IL-10 (6,7,9–11).
The proportion of persons 18–60 years of age with a ≥4-fold increase in HAI titer who received 1 dose (15 μg) of monovalent pandemic (H1N1) 2009 nonadjuvant vaccine was 96.2%, and the proportion with an increased HAI titer ≥40 was 97.1%, results similar to those of a recent study (12). However, the geometric mean titer in healthy vaccinated persons was 237.8, a 34.5-fold increase over the prevaccination titer, which was greater than that for patients naturally infected with pandemic (H1N1) 2009 virus (12). This finding may have resulted from impaired adaptive immune responses against pandemic (H1N1) 2009 virus in the initial phase, which included decreased numbers of CD4 and B lymphocytes and an increase in T regulatory cells (4).
In conclusion, our data indicated changes in cellular profiles during pandemic (H1N1) 2009 virus infection; showed that transient production of IL-6, IFN-γ, and IL-10 are main effectors of the early innate immune response against pandemic (H1N1) 2009 virus; and indicated that adaptive immune responses are impaired in the initial phase after infection. These factors may help clarify the pathogenesis of pandemic (H1N1) 2009 virus and provide new approaches in overcoming severe infections.
References
- Centers for Disease Control and Prevention. Swine influenza A (H1N1) infection in two children—Southern California, March–April 2009. MMWR Morb Mortal Wkly Rep. 2009;58:400–2.PubMedGoogle Scholar
- Centers for Disease Control and Prevention. Outbreak of swine-origin influenza A (H1N1) virus infection— Mexico, March–April 2009. MMWR Morb Mortal Wkly Rep. 2009;58:467–70.PubMedGoogle Scholar
- Cao B, Li XW, Mao Y, Wang J, Lu HZ, Chen YS, Clinical features of the initial cases of 2009 pandemic influenza A (H1N1) virus infection in China. N Engl J Med. 2009;361:2507–17. DOIPubMedGoogle Scholar
- Giamarellos-Bourboulis EJ, Raftogiannis M, Antonopoulou A, Bazaiaka F, Koutoukas P, Savva A, Effect of the novel influenza A (H1N1) virus in the human immune system. PLoS ONE. 2009;4:e8393. DOIPubMedGoogle Scholar
- Bermejo-Martin JF, Ortiz de Lejarazu R, Pumarola T, Rello J, Almansa R, Ramirez P, Th1 and Th17 hypercytokinemia as early host response signature in severe pandemic influenza. Crit Care. 2009;13:R201. DOIPubMedGoogle Scholar
- Hayden FG, Fritz R, Lobo MC, Alvord W, Strober W, Straus SE. Local and systemic cytokine responses during experimental human influenza A virus infection. Relation to symptom formation and host defense. J Clin Invest. 1998;101:643–9. DOIPubMedGoogle Scholar
- Kaiser L, Fritz RS, Straus SE, Gubareva L, Hayden FG. Symptom pathogenesis during acute influenza: interleukin-6 and other cytokine responses. J Med Virol. 2001;64:262–8. DOIPubMedGoogle Scholar
- Van Reeth K. Cytokines in the pathogenesis of influenza. Vet Microbiol. 2000;74:109–16. DOIPubMedGoogle Scholar
- Sheng WH, Chiang BL, Chang SC, Ho HN, Wang JT, Chen YC, Clinical manifestations and inflammatory cytokine responses in patients with severe acute respiratory syndrome. J Formos Med Assoc. 2005;104:715–23.PubMedGoogle Scholar
- Kobasa D, Jones SM, Shinya K, Kash JC, Copps J, Ebihara H, Aberrant innate immune response in lethal infection of macaques with the 1918 influenza virus. Nature. 2007;445:319–23. DOIPubMedGoogle Scholar
- Itoh Y, Shinya K, Kiso M, Watanabe T, Sakoda Y, Hatta M, In vitro and in vivo characterization of new swine-origin H1N1 influenza viruses. Nature. 2009;460:1021–5.PubMedGoogle Scholar
- Zhu FC, Wang H, Fang HH, Yang JG, Lin XJ, Liang XF, A novel influenza A (H1N1) vaccine in various age groups. N Engl J Med. 2009;361:2414–23. DOIPubMedGoogle Scholar
Figures
Table
Cite This Article1These authors contributed equally to this article.
Table of Contents – Volume 17, Number 6—June 2011
| EID Search Options |
|---|
|
|
|
|
|
|


Please use the form below to submit correspondence to the authors or contact them at the following address:
Bo-An Li, Center of Laboratory Medicine, Beijing 302 Hospital, 100 W 4th Ring Middle Rd, Beijing 100039, People’s Republic of China
Top