Volume 18, Number 2—February 2012
Dispatch
Oseltamivir-Resistant Pandemic (H1N1) 2009 Virus Infections, United States, 2010–11
Aaron D. Storms, Larisa V. Gubareva, Su Su, John T. Wheeling, Margaret Okomo-Adhiambo, Chao-Yang Pan, Erik Reisdorf, Kirsten St. George, Robert Myers, Jason T. Wotton, Sara Robinson, Brandon Leader, Martha Thompson, Marjorie Shannon, Alexander Klimov, Alicia M. Fry , and for the US Antiviral Resistance Surveillance Working Group
Figure
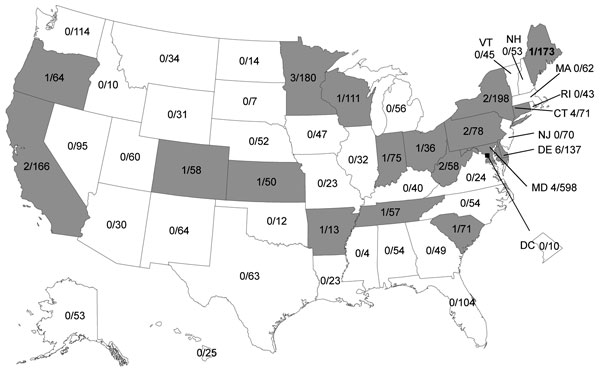
Figure. Geographic distribution of oseltamivir-resistant pandemic (H1N1) 2009 viruses in the United States, October 1, 2010–July 31, 2011. Numerators are number of oseltamivir-resistant viruses identified by state public health laboratories; denominators are number of pandemic (H1N1) 2009–positive specimens submitted by each state for susceptibility testing. Gray shading indicates states that had >1 infection with oseltamivir-resistant virus.
1Additional members of the US Antiviral Resistance Surveillance Working Group who contributed data are listed at the end of this article.
Page created: January 18, 2012
Page updated: April 18, 2012
Page reviewed: April 18, 2012
The conclusions, findings, and opinions expressed by authors contributing to this journal do not necessarily reflect the official position of the U.S. Department of Health and Human Services, the Public Health Service, the Centers for Disease Control and Prevention, or the authors' affiliated institutions. Use of trade names is for identification only and does not imply endorsement by any of the groups named above.