Volume 19, Number 10—October 2013
Letter
Transmission of Schmallenberg Virus during Winter, Germany
Kerstin Wernike, Mareen Kohn, Franz J. Conraths, Doreen Werner, Daniela Kameke, Silke Hechinger, Helge Kampen, and Martin Beer
Figure
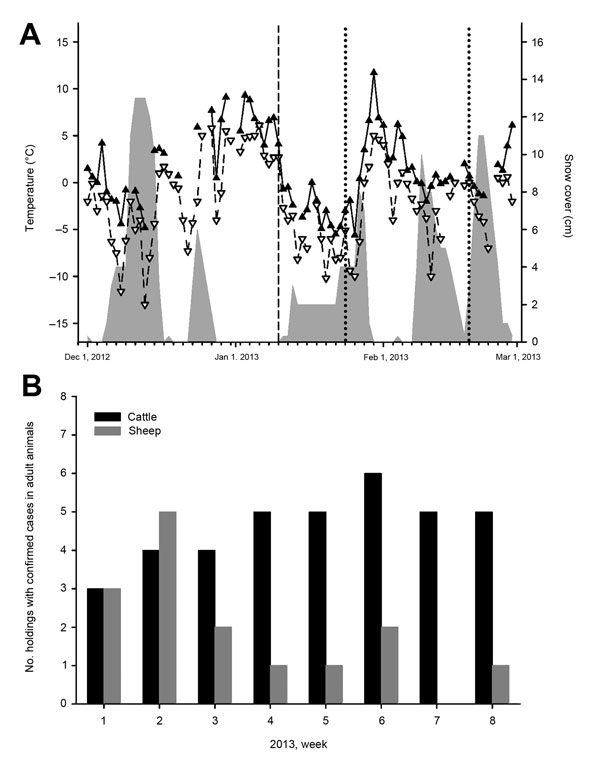
Figure. . Results of analysis of samples from sheep and cattle for Schmallenberg virus (SBV), Germany, 2012–2013. A) Climate data and sampling. The maximum temperatures are shown with filled triangles and a solid line and the minimum temperatures with unfilled triangles and a broken line. Snow cover is symbolized by a gray area. The dashed line represents the day of the detection of SBV genome in 4 sheep. Further sampling days are marked by dotted lines. B) PCR-confirmed Schmallenberg virus infections in adult cattle (black bars) or sheep (gray bars) in Germany during January 1–February 20, 2013.
Page created: September 16, 2013
Page updated: September 16, 2013
Page reviewed: September 16, 2013
The conclusions, findings, and opinions expressed by authors contributing to this journal do not necessarily reflect the official position of the U.S. Department of Health and Human Services, the Public Health Service, the Centers for Disease Control and Prevention, or the authors' affiliated institutions. Use of trade names is for identification only and does not imply endorsement by any of the groups named above.