Volume 2, Number 1—January 1996
Dispatch
Trends in Bacteremic Infection Due to Streptococcus pyogenes (Group A Streptococcus), 1986-1995
Figure
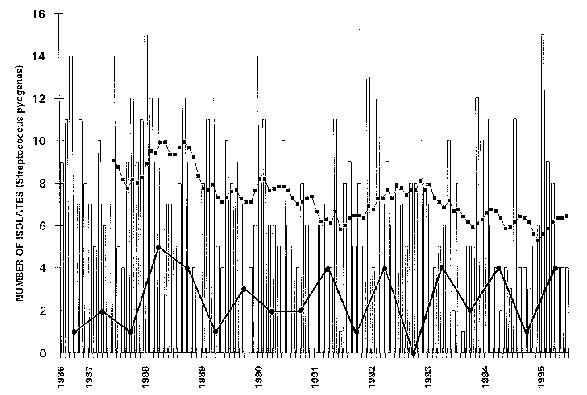
Figure. The bars show the number of isolates of Streptococcus pyogenes (GAS) each month at the VAMC, Houston. The upper line connecting solid squares indicates the running monthly average (average of the preceding 12 months). The lower line connecting solid circles indicates the number of blood cultures positive for S. pyogenes during each 6-month period.
Page created: December 20, 2010
Page updated: December 20, 2010
Page reviewed: December 20, 2010
The conclusions, findings, and opinions expressed by authors contributing to this journal do not necessarily reflect the official position of the U.S. Department of Health and Human Services, the Public Health Service, the Centers for Disease Control and Prevention, or the authors' affiliated institutions. Use of trade names is for identification only and does not imply endorsement by any of the groups named above.