Volume 21, Number 3—March 2015
Dispatch
Spatiotemporal Analysis of Guaroa Virus Diversity, Evolution, and Spread in South America
Allison Groseth, Kurt R. Wollenberg, Veena Mampilli, Taylor Shupert, Carla Weisend, Carolina Guevara, Tadeusz J. Kochel1, Robert B. Tesh, and Hideki Ebihara
Figure 1
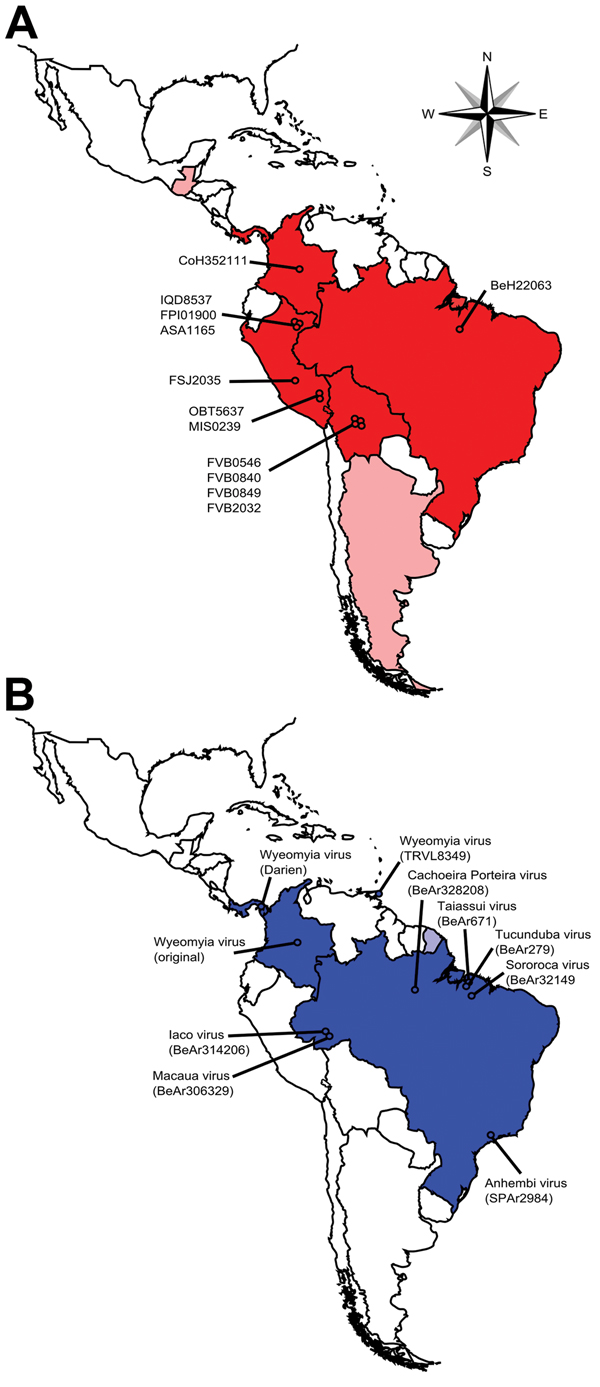
Figure 1. Comparison of the geographic locations from which Guaroa virus (GROV) strains used in this study were isolated (A) and the geographic distribution of the Wyeomyia virus (WYOV) group (B), Central and South America. Countries from which GROVs have been isolated are shown in dark red; countries from which WYOVs have been isolated are shown in dark blue. Light red indicates countries with only serologic evidence of GROV circulation; light blue indicates countries with only serologic evidence of WYOV circulation. Circles indicate the geographic locations from which the virus strains used in the present study were isolated.
1Current affiliation: National Biodefense Analysis and Countermeasures Center, Frederick, Maryland, USA.
Page created: February 20, 2015
Page updated: February 20, 2015
Page reviewed: February 20, 2015
The conclusions, findings, and opinions expressed by authors contributing to this journal do not necessarily reflect the official position of the U.S. Department of Health and Human Services, the Public Health Service, the Centers for Disease Control and Prevention, or the authors' affiliated institutions. Use of trade names is for identification only and does not imply endorsement by any of the groups named above.