Volume 25, Number 6—June 2019
Perspective
Using Big Data to Monitor the Introduction and Spread of Chikungunya, Europe, 2017
Joacim Rocklöv , Yesim Tozan, Aditya Ramadona, Maquines O. Sewe, Bertrand Sudre, Jon Garrido, Chiara Bellegarde de Saint Lary, Wolfgang Lohr, and Jan C. Semenza
Figure 3
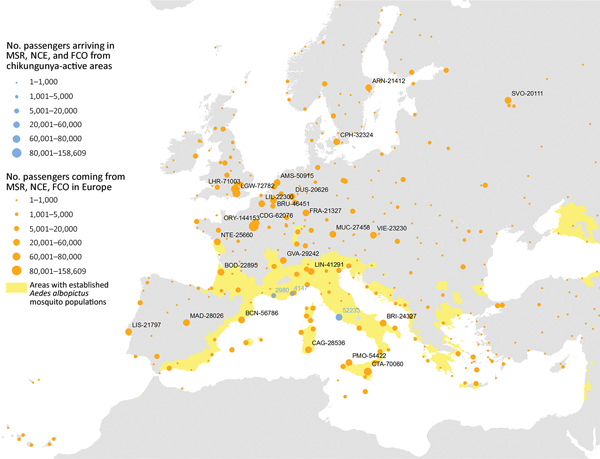
Figure 3. Incoming passengers from chikungunya active transmission areas and outgoing passengers to other airports in Europe from Rome (FCO), Marseille (MRS), and Nice (NCE) airports, August 2017. The stable vector presence area is highlighted in yellow.
Page created: May 20, 2019
Page updated: May 20, 2019
Page reviewed: May 20, 2019
The conclusions, findings, and opinions expressed by authors contributing to this journal do not necessarily reflect the official position of the U.S. Department of Health and Human Services, the Public Health Service, the Centers for Disease Control and Prevention, or the authors' affiliated institutions. Use of trade names is for identification only and does not imply endorsement by any of the groups named above.