Skip directly to site content Skip directly to page options Skip directly to A-Z link Skip directly to A-Z link Skip directly to A-Z link
Volume 26, Number 10—October 2020
Synopsis

Nationwide External Quality Assessment of SARS-CoV-2 Molecular Testing, South Korea

Heungsup Sung1Comments to Author , Myung-Guk Han, Cheon-Kwon Yoo, Sang-Won Lee, Yoon-Seok Chung, Jae-Sun Park, Mi-Na Kim, Hyukmin Lee, Ki Ho Hong, Moon-Woo Seong, Kyunghoon Lee, Sail Chun, Wee Gyo Lee, Gye-Cheol Kwon, and Won-Ki Min1Comments to Author 
Author affiliations: University of Ulsan College of Medicine and Asan Medical Center, Seoul, South Korea (H. Sung, M.-N. Kim, S. Chun, W.K. Min); Korea Centers for Disease Control and Prevention, Chungcheongbuk-do, South Korea (M.-G. Han, C.-K. Yoo, S.-W. Lee, Y.-S. Chung, J.-S. Park); Yonsei University College of Medicine, Seoul (H. Lee); Seoul Medical Center, Seoul (K.-H. Hong); Seoul National University College of Medicine, Seoul (M.-W. Seong, K. Lee); Ajou University School of Medicine, Suwon, South Korea (W.G. Lee); Chungnam National University School of Medicine, Daejeon, South Korea (G.-C. Kwon)

Main Article

Figure 1

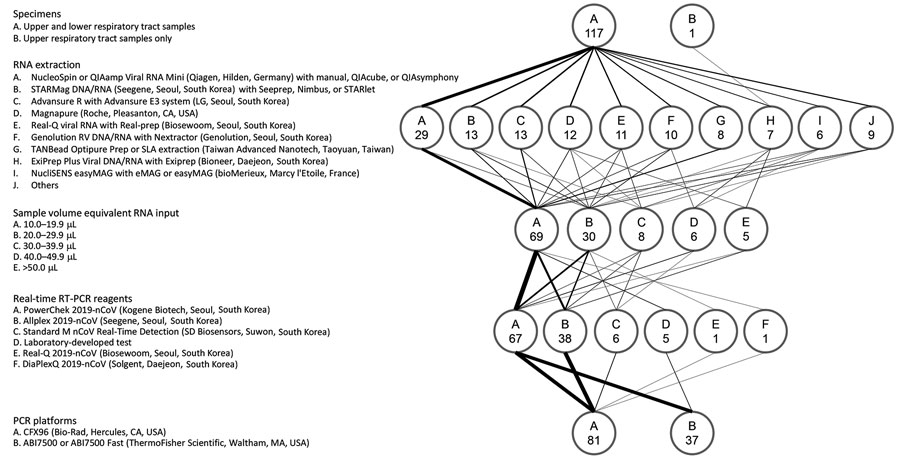
Protocols used for real-time RT-PCR in 118 laboratories participating in an external quality assessment of severe acute respiratory syndrome coronavirus 2 testing, South Korea, March 23–27, 2020. The flow diagram shows the variations in specimens tested, RNA extraction platforms, PCR reagents and amplification platforms, and sample volume equivalent RNA input used in the PCR reaction. The weight of the lines reflects the number of laboratories using a particular step. Numbers in the circles indi

Figure 1. Protocols used for real-time RT-PCR in 118 laboratories participating in an external quality assessment of severe acute respiratory syndrome coronavirus 2 testing, South Korea, March 23–27, 2020. The flow diagram shows the variations in specimens tested, RNA extraction platforms, PCR reagents and amplification platforms, and sample volume equivalent RNA input used in the PCR reaction. The weight of the lines reflects the number of laboratories using a particular step. Numbers in the circles indicate number of laboratories. RT-PCR, reverse transcription PCR.

Main Article

1These authors contributed equally to this article.

Page created: July 14, 2020
Page updated: September 17, 2020
Page reviewed: September 17, 2020
The conclusions, findings, and opinions expressed by authors contributing to this journal do not necessarily reflect the official position of the U.S. Department of Health and Human Services, the Public Health Service, the Centers for Disease Control and Prevention, or the authors' affiliated institutions. Use of trade names is for identification only and does not imply endorsement by any of the groups named above.
file_external