Volume 26, Number 8—August 2020
Research
Evaluating the Effectiveness of Social Distancing Interventions to Delay or Flatten the Epidemic Curve of Coronavirus Disease
Laura Matrajt and Tiffany Leung
Figure 4
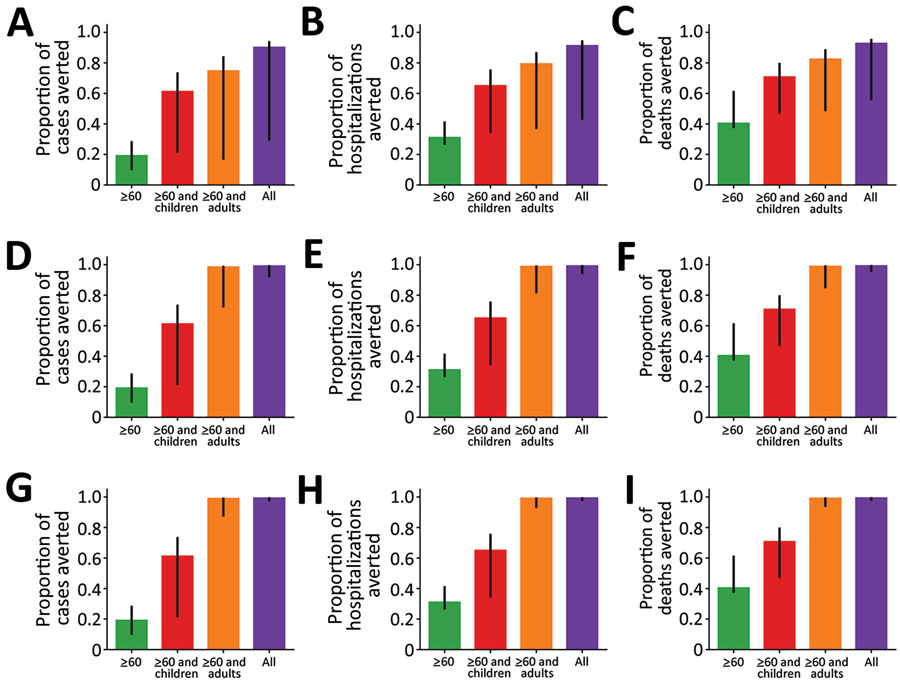
Figure 4. Proportion of coronavirus disease cases, hospitalizations, and deaths averted during 100 days for various social distancing scenarios in which adults reduce their contact by 25% (A–C); 75% (D–F); and 95% (G–I). We used parameter values of R0 = 3, γ = 1/5.02, σ = 1/5.16. Error bars represent results of 1,000 parameter simulations with the top and bottom 2.5% simulations removed.
Page created: June 05, 2020
Page updated: July 17, 2020
Page reviewed: July 17, 2020
The conclusions, findings, and opinions expressed by authors contributing to this journal do not necessarily reflect the official position of the U.S. Department of Health and Human Services, the Public Health Service, the Centers for Disease Control and Prevention, or the authors' affiliated institutions. Use of trade names is for identification only and does not imply endorsement by any of the groups named above.