Volume 26, Number 9—September 2020
Research Letter
Effects of Proactive Social Distancing on COVID-19 Outbreaks in 58 Cities, China
Figure
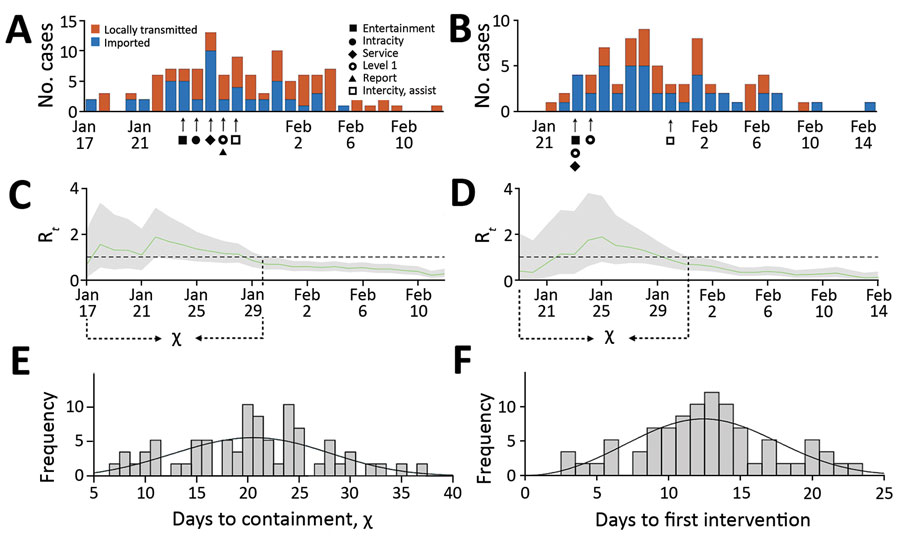
Figure. Coronavirus disease (COVID-19) introductions, transmission, and containment for 2 provincial capitals, China, before February 15, 2020. A) Estimated daily incidence of COVID-19 cases and the implementation of local social distancing measures in Xi’an. B) Estimated daily incidence of COVID-19 cases and the implementation of local social distancing measures in Nanjing. C, D) Estimated daily time-varying reproduction numbers (Rt). Green line indicates the median and gray shading 95% CI for Rt. We calculated the number of days from the first reported imported case until the upper 95% CI drops below 1 (χ) for (C) Xi’an and (D) Nanjing. E) The distribution of χ across 58 cities in mainland China. Mean duration of outbreaks is 21 days (SD + 7). Based on an area under the curve comparison between gamma, log-normal, and Weibull distributions fitted via maximum-likelihood to the data, we found that the χ values are roughly Weibull distributed with scale 22.94 (95% CI 21.12–24.91) and shape 3.28 (95% CI 2.68–4.02), indicated by black line. F) The distribution of time between the first locally reported case and the first social distancing measure resembles a Weibull distribution with scale 14.24 (95% CI 13.01–15.60) and shape 2.98 (95% CI 2.44–3.65).