Volume 27, Number 2—February 2021
Research
Excess Deaths during Influenza and Coronavirus Disease and Infection-Fatality Rate for Severe Acute Respiratory Syndrome Coronavirus 2, the Netherlands
Liselotte van Asten , Carel N. Harmsen, Lenny Stoeldraijer, Don Klinkenberg, Anne C. Teirlinck, Marit M.A. de Lange, Adam Meijer, Jan van de Kassteele, Arianne B. van Gageldonk-Lafeber, Susan van den Hof, and Wim van der Hoek
Figure 2
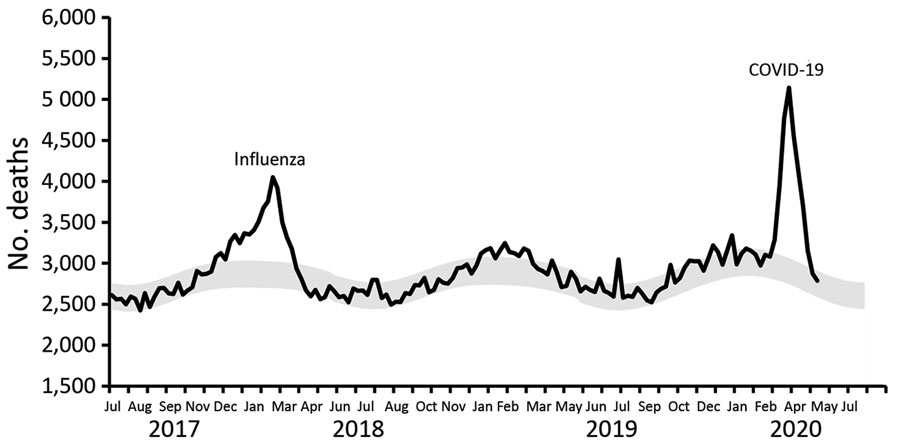
Figure 2. Excess deaths during influenza and COVID-19 and infection-fatality rate for severe acute respiratory syndrome coronavirus 2, the Netherlands. Weekly deaths and expected baseline deaths (July 2017–June 2020). Black line indicates weekly number of deaths (black line). Weeks run Thursday through Wednesday. Gray shading indicates lower and upper limits of expected baseline weekly deaths. COVID-19, coronavirus disease.
Page created: November 16, 2020
Page updated: January 23, 2021
Page reviewed: January 23, 2021
The conclusions, findings, and opinions expressed by authors contributing to this journal do not necessarily reflect the official position of the U.S. Department of Health and Human Services, the Public Health Service, the Centers for Disease Control and Prevention, or the authors' affiliated institutions. Use of trade names is for identification only and does not imply endorsement by any of the groups named above.