Volume 28, Number 4—April 2022
Research
Decrease in Tuberculosis Cases during COVID-19 Pandemic as Reflected by Outpatient Pharmacy Data, United States, 2020
Figure 1
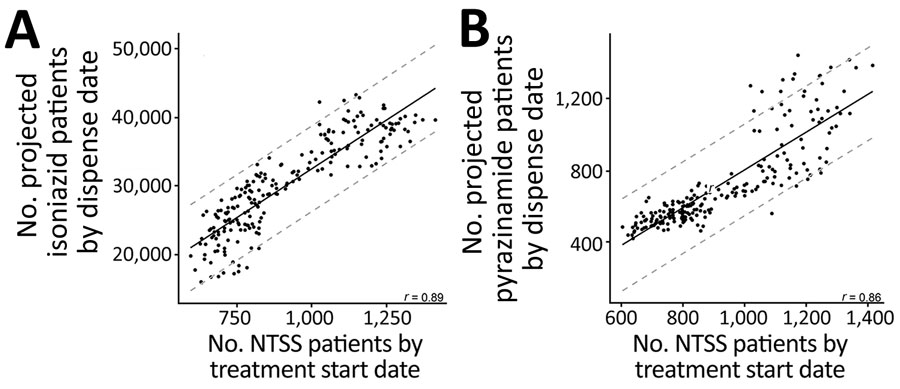
Figure 1. Correlation between National Tuberculosis Surveillance System case counts and IQVIA (https://www.iqvia.com) projected patient counts for isoniazid (A) or pyrazinamide (B) prescriptions, United States, 2006–2019. Horizontal axes show patient counts aggregated by treatment start date, removing patients who had reported resistance to isoniazid or pyrazinamide. Vertical axes show IQVIA projected patient counts aggregated by date drug was dispensed (data are on different scales). Each point represents a month, and all data during 2006–2019 are shown. Solid black lines represent regression fit for a linear model between the 2 databases; dashed gray lines indicate 95% prediction intervals. The Pearson correlation coefficient (r) is shown in the lower righthand corner of each plot.