Volume 29, Number 8—August 2023
Synopsis
Spatial Epidemiologic Analysis and Risk Factors for Nontuberculous Mycobacteria Infections, Missouri, USA, 2008–2019
Carlos Mejia-Chew , Miguel A. Chavez, Min Lian, Angela McKee, Leighton Garrett, Thomas C. Bailey, Andrej Spec, Mansi Agarwal, and George Turabelidze
Figure 2
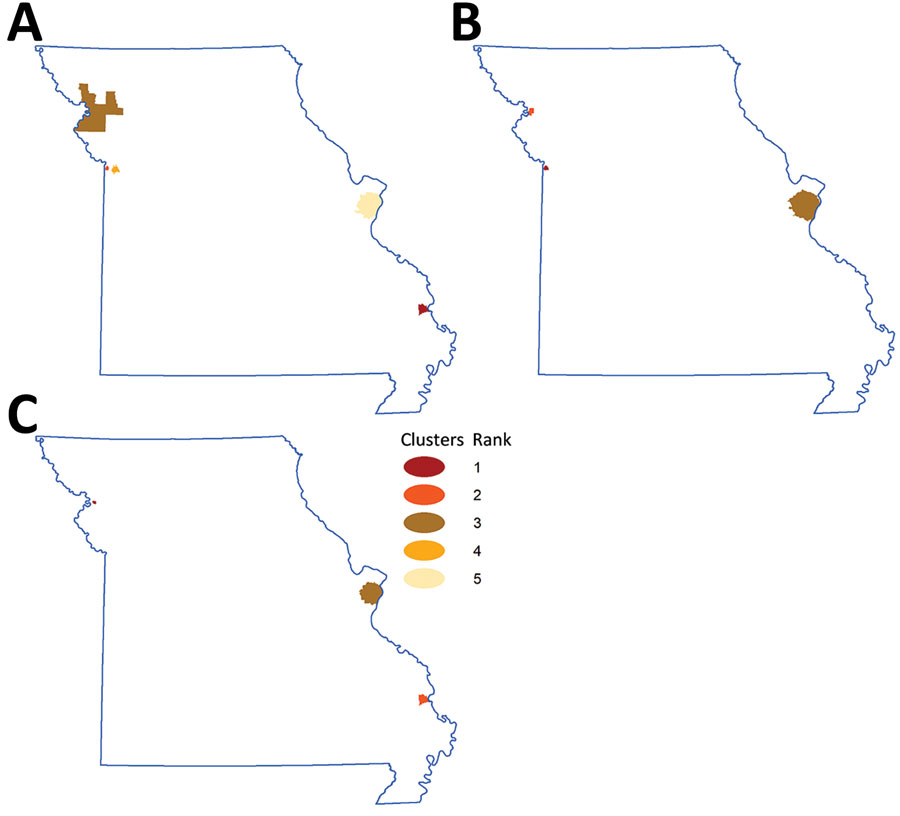
Figure 2. Geographic hotspots of nontuberculous mycobacteria (NTM) infection, by NTM type, Missouri, USA, 2008–2019. Colors indicate rank order, based on relative risk point estimates. A) For all NTM infections, relative risk was 3.62 for rank 1, 2.45 for rank 2, 2.19 for rank 3, 1.66 for rank 4, and 1.53 for rank 5. B) For rapid-growing NTM, relative risk was 3.84 for rank 1, 2.69 for rank 2, and 1.99 for rank 3. C) For slow-growing NTM, relative risk was 5.42 for rank 1, 4.52 for rank 2, and 1.42 for rank 3.
Page created: June 14, 2023
Page updated: July 20, 2023
Page reviewed: July 20, 2023
The conclusions, findings, and opinions expressed by authors contributing to this journal do not necessarily reflect the official position of the U.S. Department of Health and Human Services, the Public Health Service, the Centers for Disease Control and Prevention, or the authors' affiliated institutions. Use of trade names is for identification only and does not imply endorsement by any of the groups named above.