Computerized Decision Support Systems Informing Community-Acquired Pneumonia Surveillance, France, 2017–2023
Tristan Delory
1
, Josselin Le Bel
1, Raphaëlle Métras, Caroline Guerrisi, Ilona E. Suhanda, Elisabeth Bouvet, Sylvie Lariven, and Pauline Jeanmougin
Author affiliation: Centre Hospitalier Annecy Genevois, Epagny Metz-Tessy, France (T. Delory); Antibioclic Steering Committee, Paris, France (T. Delory, J. Le Bel, E. Bouvet, S. Lariven, P. Jeanmougin); Sorbonne Université, INSERM, Institut Pierre Louis d'Épidémiologie et de Santé Publique, Paris (T. Delory, R. Metras, C. Guerrisi, I.E. Suhanda); Université Paris Cité, Paris (J. Le Bel); Université Paris Cité et Université Sorbonne Paris Nord, INSERM, Paris (J. Le Bel); Université de Nantes, Nantes, France (P. Jeanmougin)
Main Article
Figure 2

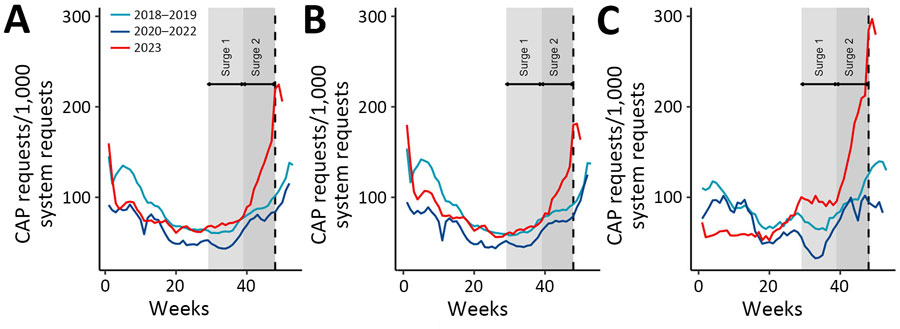
Figure 2. Rate of community-acquired pneumonia as indicated within the Antibioclic computerized decision support system, France, December 2017–January 2024. A) Overall population; (B) adults; (C) children. Light blue line indicates average number of system requests in 2018–2019 (pre‒COVID-19 pandemic); dark blue line indicates average number of system requests in 2020–2022 (during pandemic); red line indicates average number of system requests in 2023. Light gray area indicates a surge in 2023 starting in epidemiologic week 29 and dark gray indicates surge in 2023 starting in week 39; we noted that surges began earlier in children than adults. The dashed vertical line represents the first national alert from the Ministry of Health associated with a possible outbreak of Mycoplasma pneumoniae.
Main Article
Page created: October 07, 2024
Page updated: October 22, 2024
Page reviewed: October 22, 2024
The conclusions, findings, and opinions expressed by authors contributing to this journal do not necessarily reflect the official position of the U.S. Department of Health and Human Services, the Public Health Service, the Centers for Disease Control and Prevention, or the authors' affiliated institutions. Use of trade names is for identification only and does not imply endorsement by any of the groups named above.
