Volume 30, Number 11—November 2024
Research
SARS-CoV-2 Infection in School Settings, Okinawa Prefecture, Japan, 2021–2022
Yoshihiro Takayama, Yusuke Shimakawa, Ryota Matsuyama, Gerardo Chowell, Ryosuke Omori, Tetsuharu Nagamoto, Taro Yamamoto, and Kenji Mizumoto
Figure 3
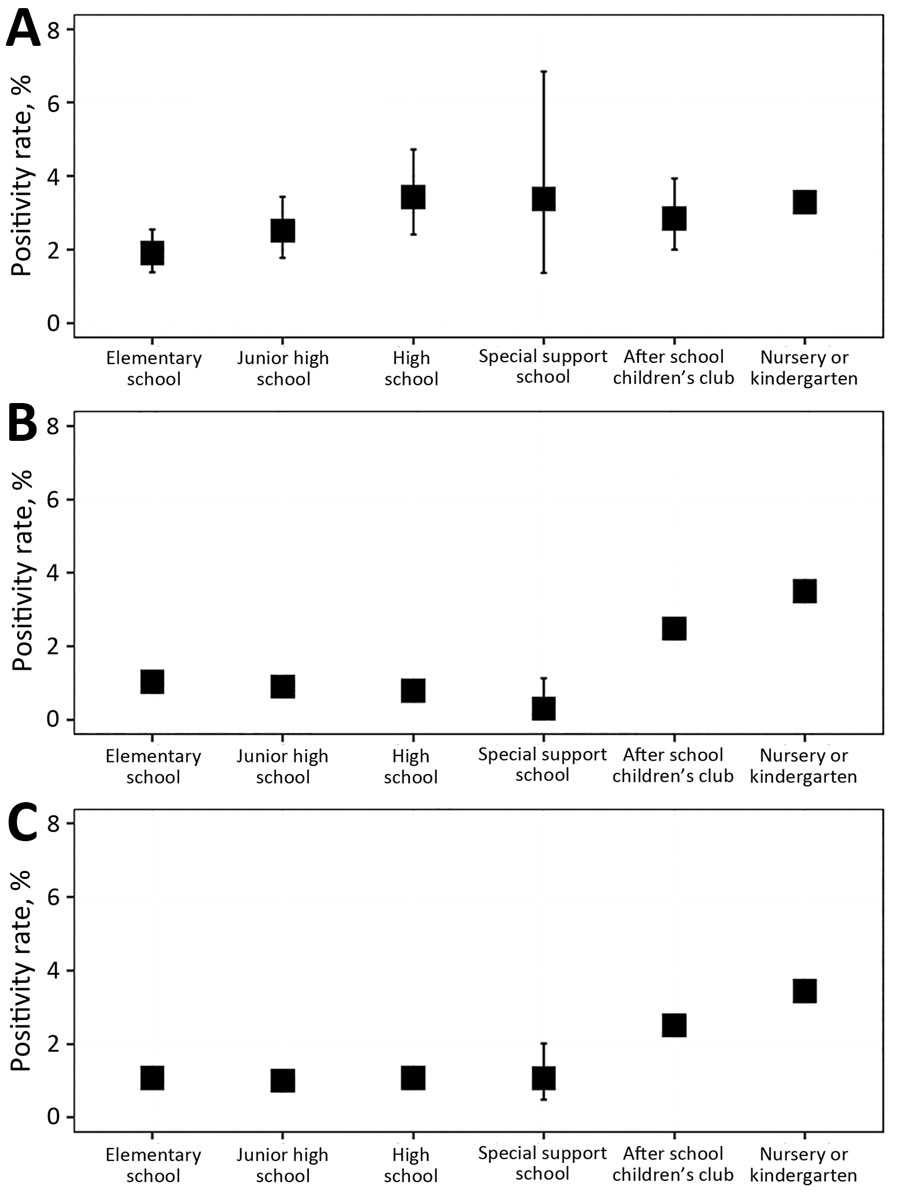
Figure 3. SARS-CoV-2 positivity rates in school settings among close contacts (A), non–close contacts (B), and all contacts (C) of infected children, by school type, Okinawa Prefecture, Japan, 2021–2022. In all panels, boxes indicate mean positivity rate and error bars indicate 95% CIs.
Page created: October 02, 2024
Page updated: October 22, 2024
Page reviewed: October 22, 2024
The conclusions, findings, and opinions expressed by authors contributing to this journal do not necessarily reflect the official position of the U.S. Department of Health and Human Services, the Public Health Service, the Centers for Disease Control and Prevention, or the authors' affiliated institutions. Use of trade names is for identification only and does not imply endorsement by any of the groups named above.