Disclaimer: Early release articles are not considered as final versions. Any changes will be reflected in the online version in the month the article is officially released.
Volume 31, Number 5—May 2025
Research
Powassan and Eastern Equine Encephalitis Virus Seroprevalence in Endemic Areas, United States, 2019–2020
Suggested citation for this article
Abstract
Powassan virus (POWV) and Eastern equine encephalitis virus (EEEV) are regionally endemic arboviruses in the United States that can cause neuroinvasive disease and death. Recent identification of EEEV transmission through organ transplantation and POWV transmission through blood transfusion have increased concerns about infection risk. After historically high numbers of cases of both viruses were reported in 2019, we conducted a seroprevalence survey using blood donation samples from selected endemic counties. Specimens were screened for virus-specific neutralizing antibodies, and population seroprevalence was estimated using weights calibrated to county population census data. For POWV, median county seroprevalence in 4 states was 0.84%, ranging from 0% (95% CI 0%–2.28%) to 11.5% (95% CI 0.82%–40.9%). EEEV infection was identified in a single county (estimated seroprevalence 1.62% [95% CI 0.04%–8.75%]). Although seroprevalence estimates in sampled areas were generally low, additional investigation of higher-prevalence areas could inform risk for transmission from asymptomatic blood and organ donors.
Powassan virus (POWV) and Eastern equine encephalitis virus (EEEV) are geographically focal arthropodborne viruses (arboviruses) in the United States (1–3). Most human infections are asymptomatic, but both viruses can cause disease ranging from acute febrile illness to severe encephalitis that can cause long-term disability or death. Recent increases in disease cases, outbreaks with high rates of illness and deaths, and identification of blood and organ donor–transmitted infections have led to greater concerns about human risk.
POWV, a flavivirus in the tickborne encephalitis serogroup, is spread to humans primarily by Ixodes spp. ticks in eastern Canada and the upper Midwest and Northeast United States (2). The number of POWV disease cases reported to the Centers for Disease Control and Prevention (CDC) has been rising; an average of 10 cases were reported annually before 2016, compared with 30 cases reported annually during 2016–2022 (4). In 2018, a probable case of blood transfusion transmission of POWV from a Wisconsin donor was identified in a kidney transplant recipient with neuroinvasive disease (5).
EEEV is an alphavirus spread to humans by several species of mosquitoes, most often near freshwater hardwood swamps in US states of the Atlantic, Gulf Coast, and Great Lakes regions (6). EEEV disease has the highest reported case-fatality rate among arboviral diseases endemic to the United States; 78 (41%) deaths were reported among 189 neurologic cases of EEEV disease during 2003–2022 (7). In 2017, EEEV disease developed in 3 organ transplant recipients who received an organ from an infected donor, and 2 died (8). In 2019, a record number of EEEV disease cases was reported during a multistate outbreak of 34 cases in 7 states with 12 (35%) fatalities (9,10).
Few POWV and EEEV seroprevalence studies have been performed to assess the burden of infection. We conducted a seroprevalence study using residual blood donation samples collected from persons residing in selected POWV- and EEEV-endemic areas during 2019–2020 to determine infection risk among county residents and to assess potential risk to the blood supply for these pathogens.
Ethics Considerations
Routine informed consent obtained at the time of blood donation includes potential use of samples and demographic information for research purposes. The protocol for this study was approved by the American Red Cross Institutional Review Board (protocol no. 2021-038).
Study Population
We obtained residual serum and plasma samples from blood donations collected by the American Red Cross during December 2019–July 2020 from a selected number of states and counties. We restricted the study population to unique blood donors (all >16 years of age) who resided in a county endemic for either POWV or EEEV, which we defined as having either >2 human disease cases in 2019 or 1 case in 2019 and >1 case during 2010–2018 reported to CDC’s ArboNET, the national arboviral disease surveillance system. We designed the criteria to capture counties with suitable habitats for the sustained circulation of the viruses resulting in human disease cases; however, we limited counties assessed to those with available blood donor samples.
Sampling Strategy
We selected samples using proportional-to-size stratified sampling by county. We specified the expected seroprevalences and acceptable margins of error (ME) on the basis of the only known previously published seroprevalence estimates, both from focal areas of New Jersey that experienced outbreaks of human POWV disease in 2019 (11) and EEEV disease in 1959 (12). For POWV, the expected seroprevalence was 0.5% and the ME 0.4%. Given the low expected seroprevalence, we used the available blood donor population, rather than the county population, to calculate sample sizes. For EEEV, the expected seroprevalence was 3% and the ME 2%. We used the 2020 United States Census Bureau County population of adults to determine the sample size needed to calculate EEEV population seroprevalence (13). We randomly chose samples from the available pool of donor samples in each county.
Laboratory Testing
We first screened samples for the presence of neutralizing antibodies against POWV, EEEV, or both, depending on the endemic county (Table 1). For initial POWV screening, we used a reporter virus–based microfocus neutralization reduction test (R-mFRNT) to identify positive samples as those with a 90% R-mFRNT (R-mFRNT90) titer >10. For EEEV, we used plaque reduction neutralization test (PRNT) to identify positive samples as those with a 90% PRNT (PRNT90) titer >10 (14). The high-throughput R-mFRNT method is based on the same principle as PRNT in measuring virus infection foci (plaques) reduction by neutralizing antibodies (15). The method uses live reporter–POWV and reporter–West Nile virus (WNV) that were engineered using the chimeric platform previously described (16). We validated the R-mFRNT90 using reporter viruses against PRNT90 using wild-type viruses with panels of positive POWV or WNV samples before use in this study and found strong correlation of the 90% effective concentrations between the R-mFRNT90 and PRNT90 assays.
We also endpoint titrated samples that screened positive for POWV neutralizing antibodies for both POWV and WNV by R-mFRNT90 to assess potential cross-reactivity between the 2 flaviviruses. We conducted the endpoints of R-mFRNT90 in 2-fold serial dilutions of samples in triplicate to determine the effective concentration for 90% neutralization (EC90; concentration is the log10 reciprocal of dilutions) by the 4-parameter logistic curve analysis using GraphPad Prism version 10.1.2 (GraphPad Software Inc., https://www.graphpad.com). We used a >4-fold difference in the R-mFRNT90 to confirm exposure to POWV or WNV. We considered similar titers (<4-fold difference) to both viruses as undifferentiated flavivirus exposures and did not include them in POWV seroprevalence estimates. We then tested samples positive for POWV- and EEEV-neutralizing antibodies for presence of IgM using IgM capture ELISA (MAC-ELISA) for POWV and a microsphere immunoassay for EEEV to assess for evidence of recent infection, as previously described (17,18).
Statistical Analysis
We calculated seroprevalence estimates and 95% CIs at the county population level by calibrating the sample design weights to population age group distributions obtained from the 2020 US Census Bureau data (13). We calibrated sample weights using poststratification to the census data on the basis of the age group of the blood donors and county population. For the weighting calibration, we grouped age into 4 categories (Table 1) according to previously described methods (19). We computed estimates both for presence of neutralizing antibodies (any previous infection) and for presence of both neutralizing antibodies and IgM (recent infection) (20). We excluded counties with <5 blood donor samples because of instability in the estimates. For the county in which the source of infection was most likely outside the county of residence according to previous case investigations by the state health department, we restricted seroprevalence estimates to the county blood donor population, rather than to the general population.
To estimate the percentage of EEEV infections that resulted in neuroinvasive disease, we multiplied estimated county IgM seroprevalence (with 95% CI) by the county population (>15 years of age, the closest available census data age category to the blood donor population) for the expected number of recent infections. We then divided the reported number of EEEV disease cases during June 2019–July 2020 by the expected number of recent infections (95% CI). We assumed IgM against EEEV persisted for up to 6 months for this calculation (21,22). We analyzed data using R version 4.3.1 using the survey package version 4.2 (23).
POWV Seroprevalence
Figure 1
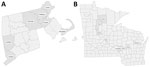
Figure 1. Selected counties for Powassan virus sampling in in study of Powassan virus and Eastern equine encephalitis virus seroprevalence in endemic areas, United States, 2019–2020. A) Connecticut and Massachusetts; B) Minnesota...
We tested a total of 1,770 samples from 15 counties in 4 states (Connecticut, Massachusetts, Minnesota, and Wisconsin) for evidence of POWV infection (Table 1; Figure 1). We found 50 (2.8%) samples had neutralizing antibodies for either POWV or WNV; 3 of those samples had WNV-specific neutralizing antibodies and 31 had indistinguishable results. Sixteen samples had POWV-specific neutralizing antibodies: 4 from Connecticut, 5 from Massachusetts, 3 from Minnesota, and 4 from Wisconsin (Table 2). County estimates by state among counties with locally acquired POWV infections ranged from 0% (95% CI 0%–2.28%) to 11.5% (95% CI 0.82%–40.9%). The highest and almost equivalent estimates were in 2 neighboring counties in Wisconsin: 11.5% (95% CI 0.82%–40.9%) and 11.5% (95% CI 0.87%–40.3%). Of the 16 samples with POWV-specific neutralizing antibodies, 6 (38%) were IgM positive. Recent seroprevalence estimates by county ranged from 0% (95% CI 0%–2.28%) to 1.68% (95% CI 0.14%–6.70%) (Table 2). In Anoka County, Minnesota, where cases were considered likely to be travel-associated, estimated county blood donor seroprevalence was 1.42% (95% CI 0.39%–5.02%) for any infection and 0.71% (95% CI 0.04%–3.91%) for recent infection (Table 2).
EEEV Seroprevalence
Figure 2
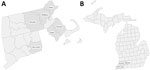
Figure 2. Selected counties for Eastern equine encephalitis virus sampling in study of Powassan virus and Eastern equine encephalitis virus seroprevalence in endemic areas, United States, 2019–2020. A) Connecticut and Massachusetts; B)...
We tested a total of 567 samples from 10 counties in 3 states (Connecticut, Massachusetts, and Michigan) for evidence of EEEV infection (Table 1; Figures 2). Only 1 sample in Worcester County, Massachusetts, was positive for both neutralizing antibodies and IgM against EEEV, for an estimated recent infection seroprevalence of 1.62% (95% CI 0.04%–8.75%) (Table 3). The demographics of this blood donor did not match any of the EEEV disease case-patients reported to ArboNET; therefore, the donor most likely had an asymptomatic infection or nonneuroinvasive disease that was not diagnosed. The estimated total number of recent infections in Worcester was 11,086 (95% CI 272–59,912), and 3 human EEEV neuroinvasive disease cases were reported in the county in 2019, for a neuroinvasive disease–to-infection percentage of 0.027% (95% CI 0.005%–1.10%).
On the basis of this blood donor serosurvey, we estimated that population seroprevalence for POWV and EEEV in the counties sampled is generally low. The finding of a low number of infections suggests the risk to the blood supply is minimal in most areas surveyed. However, 2 adjacent counties in Wisconsin had higher POWV seroprevalence than the others, suggesting a potential risk for blood donor infection, although the estimates were imprecise because of small numbers of blood donor samples available from those locations.
Limited data are published on human seroprevalence for POWV and EEEV. For POWV, in a household survey conducted after a 2019 cluster of POWV disease cases in a focal area of New Jersey, estimated neutralizing antibody seroprevalence was 1.1% (95% CI 0%–2.3%) and IgM seroprevalence was 0.31% (95% CI 0.04%–1.0%) (11). Those estimates fell within the range of our county estimates for the 2 East Coast states in this study, Connecticut and Massachusetts, despite differences in methodologies and locations sampled. However, we did find higher POWV seroprevalence estimates in some Wisconsin counties. Geographic variation in occurrence and seroprevalence has been well documented for vectorborne diseases and is likely dependent on several factors, such as vector density, infection prevalence in vectors and animal reservoirs, climate effects on ecology, and human behavior affecting a person’s risk for infection (24). Further study is warranted to obtain a more precise estimate of POWV seroprevalence in these counties in Wisconsin, the state of residence for the blood donor implicated in the only reported transfusion-transmitted POWV infection (5), to determine whether risk for infection might be heightened in that region.
The imprecision in the POWV estimates, particularly in the Midwestern states, precluded us from calculating the proportion of infections that resulted in neuroinvasive disease. Vahey et al. (11) reported that 23% (95% CI 7%–100%) of POWV infections result in neuroinvasive disease. That estimate is higher than those for WNV, in which neuroinvasive disease develops in <1% of infected persons (25–27).
Although we sampled from EEEV-endemic areas affected by the 2019 multistate EEEV disease outbreak (10), we found only 1 positive blood donor, for a county seroprevalence estimate of 1.6%. This finding was slightly lower but within the range of the only known published estimate of 2.3% (range by township 0.9%–6.2%) from a 1959 EEEV outbreak in New Jersey, despite differences in serologic methods used (12). The finding of just 1 blood donor with antibodies to EEEV after the large outbreak in the season before the samples were collected suggests that human infections are uncommon and the risk to the blood supply is limited.
Our estimate of the percentage of EEEV-infected persons who develop neuroinvasive disease was lower than that of the 1959 New Jersey study, which estimated 4.4% and ranged from 2% in younger adults to 13% in young children (12,28). Differences in the setting and methodologies of the studies make comparisons of estimates challenging; however, the upper limit of our 95% CI (1.1%) supports the approximation that <5% of EEEV infections result in neuroinvasive disease, although the risk varies by age group (12,28–30). Additional seroprevalence studies conducted after an outbreak could be done to calculate more precise estimates.
The first limitation of our study is that use of a convenience sample of blood donations collected by a single collection agency resulted in small sample sizes in some areas, limiting the precision of the estimates and our ability to assess all areas endemic for these viruses. The lack of blood donor samples from endemic areas such as New Jersey or New York precluded estimates and comparisons in those areas. Also, sample size calculations were based on the only known seroprevalence estimates from focal New Jersey outbreaks (11,12), which might have led to undersampling in some areas.
The blood donor population is not likely to be representative of the general population in all respects. In addition, the blood donor samples used for this study were collected during the early part of the COVID pandemic, which might have affected the characteristics of the donor population; donors in March 2020–February 2022 were more likely to be repeat donors who were older, white, and women than were donors in the previous 2 years (31). However, those demographic factors are not known to be associated with risk for arboviral disease. To address that limitation, we used similar weighting methods to other published studies to generate population estimates from blood donor seroprevalence (19,25,32). Our estimates are similar to those of previous household seroprevalence surveys for the target viruses (11,12), suggesting our results are plausible.
By testing for antibodies, we cannot directly determine the chance of viremia being present in a blood donor for these pathogens. However, the overall low occurrence of antibodies, including IgM, suggests that having a viremic blood donor would be even less common; for other arboviruses, IgM can persist for months to years after infection, and viremia is present for up to 2 weeks (21,33,34). In addition, studies of WNV-infected blood donors suggest that viremic donors with IgM are less likely to be infectious than those without IgM (21,35). Consistent with that hypothesis, in the only report of POWV transmission through blood transfusion, the implicated donation was RNA positive and IgM negative (5). The duration of IgM persistence in POWV and EEEV is unknown. Although nucleic acid testing could have identified potentially infectious donors, given the low seroprevalence of infection, the likelihood of detecting RNA in an asymptomatic person would have been so low as to require a much larger sample size. Finally, we could have underestimated the seroprevalence of POWV, given that >50% of the flavivirus-positive specimens could not be differentiated between POWV and WNV.
In conclusion, in POWV- and EEEV-endemic areas of the United States sampled during 2019–2020, seroprevalence estimates for POWV and EEEV infection were generally low, suggesting a low risk for transmission by blood transfusion or organ transplantation. Further studies in the Wisconsin counties with higher seroprevalence estimates using high-throughput molecular assays and larger sample sizes could lead to improved understanding of risk. Potential blood donors could lower their risk for tick and mosquito bites by taking such steps as wearing long sleeves and pants, using Environmental Protection Agency–registered insect repellent, and treating clothing and gear with permethrin. Of note, POWV can be transmitted within 15 minutes of tick attachment, so preventing ticks from attaching and removing them before attachment is key (36). CDC will continue to work with partners to monitor infectious threats to blood transfusions and organ transplantation and identify prevention and control interventions to reduce the risk among transfusion and transplant recipients.
Dr. Padda is an Epidemic Intelligence Service Officer in the Arboviral Diseases Branch, the Division of Vector-Borne Diseases, National Center for Emerging and Zoonotic Infectious Diseases, Centers for Disease Control and Prevention, Fort Collins, CO. Her research interests include infectious disease epidemiology and One Health.
References
- Calisher CH. Medically important arboviruses of the United States and Canada. Clin Microbiol Rev. 1994;7:89–116. DOIPubMedGoogle Scholar
- Krow-Lucal ER, Lindsey NP, Fischer M, Hills SL. Powassan virus disease in the United States, 2006–2016. Vector Borne Zoonotic Dis. 2018;18:286–90. DOIPubMedGoogle Scholar
- Lindsey NP, Staples JE, Fischer M. Eastern equine encephalitis virus in the United States, 2003–2016. Am J Trop Med Hyg. 2018;98:1472–7. DOIPubMedGoogle Scholar
- Centers for Disease Control and Prevention. Powassan virus: historic data (2004–2023) [cited 2024 Oct 1]. https://www.cdc.gov/powassan/data-maps/historic-data.html
- Taylor L, Stevens T, Destrampe EM, Brown JA, McGavic J, Gould CV, et al. Powassan virus infection likely acquired through blood transfusion presenting as encephalitis in a kidney transplant recipient. Clin Infect Dis. 2020.PubMedGoogle Scholar
- Ciota AT. Eastern equine encephalitis virus taxonomy, genomics, and evolution. J Med Entomol. 2022;59:14–9. DOIPubMedGoogle Scholar
- Centers for Disease Control and Prevention. Eastern equine encephalitis virus: historic data (2003–2023) [cited 2024 Oct 1]. https://www.cdc.gov/eastern-equine-encephalitis/data-maps/historic-data.html
- Pouch SM, Katugaha SB, Shieh WJ, Annambhotla P, Walker WL, Basavaraju SV, et al. Transmission of eastern equine encephalitis virus from an organ donor to three transplant recipients. Clin Infect Dis. 2018.PubMedGoogle Scholar
- Hill V, Koch RT, Bialosuknia SM, Ngo K, Zink SD, Koetzner CA, et al. Dynamics of eastern equine encephalitis virus during the 2019 outbreak in the Northeast United States. Curr Biol. 2023;33:2515–2527.e6. DOIPubMedGoogle Scholar
- Lindsey NP, Martin SW, Staples JE, Fischer M. Notes from the field: multistate outbreak of eastern equine encephalitis virus—United States, 2019. MMWR Morb Mortal Wkly Rep. 2020;69:50–1. DOIPubMedGoogle Scholar
- Vahey GM, Wilson N, McDonald E, Fitzpatrick K, Lehman J, Clark S, et al. Seroprevalence of Powassan virus infection in an area experiencing a cluster of disease cases: Sussex County, New Jersey, 2019. Open Forum Infect Dis. 2022;9:
ofac023 . DOIPubMedGoogle Scholar - Goldfield M, Sussman O. The 1959 outbreak of Eastern encephalitis in New Jersey. I. Introduction and description of outbreak. Am J Epidemiol. 1968;87:1–10. DOIPubMedGoogle Scholar
- United States Census Bureau. American community survey [cited 2023 Oct 1]. https://www.census.gov/programs-surveys/acs/data.html
- Beaty BJ, Calisher CH, Shope RE. Arboviruses. In: Lennette EH, Lennette DA, Lennette ET, editors. Diagnostic procedures for viral, rickettsial and chlamydial infections. 7th edition. Washington: American Public Health Association; 1995. p. 189–212.
- Calvert AE, Horiuchi K, Boroughs KL, Ong YT, Anderson KM, Biggerstaff BJ, et al. The specificity of the persistent IgM neutralizing antibody response in Zika virus infections among individuals with prior dengue virus exposure. J Clin Microbiol. 2021;59:
e0040021 . DOIPubMedGoogle Scholar - Baldwin WR, Livengood JA, Giebler HA, Stovall JL, Boroughs KL, Sonnberg S, et al. Purified inactivated Zika vaccine candidates afford protection against lethal challenge in mice. Sci Rep. 2018;8:16509. DOIPubMedGoogle Scholar
- Basile AJ, Horiuchi K, Panella AJ, Laven J, Kosoy O, Lanciotti RS, et al. Multiplex microsphere immunoassays for the detection of IgM and IgG to arboviral diseases. PLoS One. 2013;8:
e75670 . DOIPubMedGoogle Scholar - Martin DA, Biggerstaff BJ, Allen B, Johnson AJ, Lanciotti RS, Roehrig JT. Use of immunoglobulin m cross-reactions in differential diagnosis of human flaviviral encephalitis infections in the United States. Clin Diagn Lab Immunol. 2002;9:544–9.PubMedGoogle Scholar
- Jones JM, Stone M, Sulaeman H, Fink RV, Dave H, Levy ME, et al. Estimated US infection- and vaccine-induced SARS-CoV-2 seroprevalence based on blood donations, July 2020–May 2021. JAMA. 2021;326:1400–9. DOIPubMedGoogle Scholar
- Korn EL, Graubard BI. Confidence intervals for proportions with small expected number of positive counts estimated from survey data. Surv Methodol. 1998;24:193–201.
- Busch MP, Kleinman SH, Tobler LH, Kamel HT, Norris PJ, Walsh I, et al. Virus and antibody dynamics in acute west nile virus infection. J Infect Dis. 2008;198:984–93. DOIPubMedGoogle Scholar
- Prince HE, Tobler LH, Yeh C, Gefter N, Custer B, Busch MP. Persistence of West Nile virus-specific antibodies in viremic blood donors. Clin Vaccine Immunol. 2007;14:1228–30. DOIPubMedGoogle Scholar
- de Souza WM, Weaver SC. Effects of climate change and human activities on vector-borne diseases. Nat Rev Microbiol. 2024;22:476–91. DOIPubMedGoogle Scholar
- Busch MP, Wright DJ, Custer B, Tobler LH, Stramer SL, Kleinman SH, et al. West Nile virus infections projected from blood donor screening data, United States, 2003. Emerg Infect Dis. 2006;12:395–402. DOIPubMedGoogle Scholar
- Mostashari F, Bunning ML, Kitsutani PT, Singer DA, Nash D, Cooper MJ, et al. Epidemic West Nile encephalitis, New York, 1999: results of a household-based seroepidemiological survey. Lancet. 2001;358:261–4. DOIPubMedGoogle Scholar
- Williamson PC, Custer B, Biggerstaff BJ, Lanciotti RS, Sayers MH, Eason SJ, et al. Incidence of West Nile virus infection in the Dallas-Fort Worth metropolitan area during the 2012 epidemic. Epidemiol Infect. 2017;145:2536–44. DOIPubMedGoogle Scholar
- Goldfield M, Welsh JN, Taylor BF. The 1959 outbreak of Eastern encephalitis in New Jersey. 5. The inapparent infection:disease ratio. Am J Epidemiol. 1968;87:32–3. DOIPubMedGoogle Scholar
- Deresiewicz RL, Thaler SJ, Hsu L, Zamani AA. Clinical and neuroradiographic manifestations of eastern equine encephalitis. N Engl J Med. 1997;336:1867–74. DOIPubMedGoogle Scholar
- Luethy D. Eastern, western, and Venezuelan equine encephalitis and West Nile viruses: clinical and public health considerations. Vet Clin North Am Equine Pract. 2023;39:99–113. DOIPubMedGoogle Scholar
- Conti G, Notari EP IV, Dodd RY, Kessler D, Custer B, Bruhn R, et al.; U.S. Transfusion‐Transmissible Infections Monitoring System (TTIMS). Changes in transfusion-transmissible infection prevalence and demographics among US blood donors during the COVID-19 pandemic. Transfusion. 2024;64:1040–9. DOIPubMedGoogle Scholar
- Lindsey NP, Menitove JE, Biggerstaff BJ, Turabelidze G, Parton P, Peck K, et al. Seroprevalence of Heartland virus antibodies in blood donors, northwestern Missouri, USA. Emerg Infect Dis. 2019;25:358–60. DOIPubMedGoogle Scholar
- Griffin I, Martin SW, Fischer M, Chambers TV, Kosoy O, Falise A, et al. Zika virus IgM detection and neutralizing antibody profiles 12–19 months after illness onset. Emerg Infect Dis. 2019;25:299–303. DOIPubMedGoogle Scholar
- Staples JE, Gibney KB, Panella AJ, Prince HE, Basile AJ, Laven J, et al. Duration of West Nile virus immunoglobulin M antibodies up to 81 months following West Nile virus disease onset. Am J Trop Med Hyg. 2022;106:1721–4. DOIPubMedGoogle Scholar
- Pealer LN, Marfin AA, Petersen LR, Lanciotti RS, Page PL, Stramer SL, et al.; West Nile Virus Transmission Investigation Team. Transmission of West Nile virus through blood transfusion in the United States in 2002. N Engl J Med. 2003;349:1236–45. DOIPubMedGoogle Scholar
- Ebel GD, Kramer LD. Short report: duration of tick attachment required for transmission of powassan virus by deer ticks. Am J Trop Med Hyg. 2004;71:268–71. DOIPubMedGoogle Scholar
Figures
Tables
Suggested citation for this article: Padda H, Huang CY-H, Grimm K, Biggerstaff BJ, Ledermann JP, Raetz J, et al. Powassan and Eastern equine encephalitis virus seroprevalence in endemic areas, United States, 2019–2020. Emerg Infect Dis. 2025 May [date cited]. https://doi.org/10.3201/eid3105.240893
Original Publication Date: April 08, 2025
Table of Contents – Volume 31, Number 5—May 2025
| EID Search Options |
|---|
|
|
|
|
|
|
Please use the form below to submit correspondence to the authors or contact them at the following address:
Carolyn Gould, Centers for Disease Control and Prevention, 3156 Rampart Rd, Mailstop P-02, Fort Collins, CO 80521, USA
Top