Volume 8, Number 9—September 2002
Research
Behavioral, Physiologic, and Habitat Influences on the Dynamics of Puumala virus Infection in Bank Voles (Clethrionomys glareolus)
Sophie Escutenaire* , Patrice Chalon†, Florence de Jaegere, Lucie Karelle-Bui†, Georges Mees†, Bernard Brochier*, Francine Rozenfeld, and Paul-Pierre Pastoret†
Figure 3
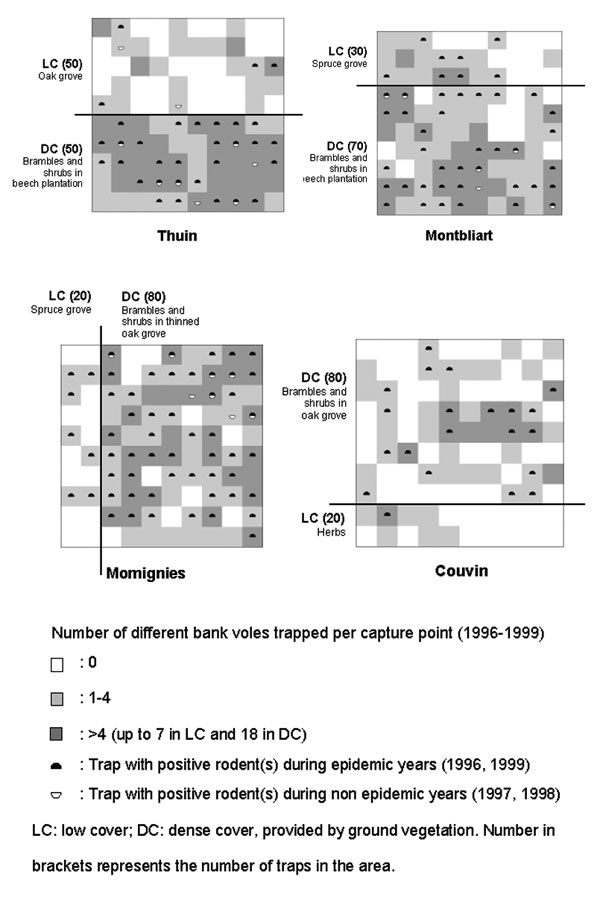
Figure 3. Distribution of trapped bank voles through 1996–1999 and representation of the vegetation cover. On each grid, the 100 live traps are represented by white, light, or dark gray squares. LC, low cover; DC, dense cover provided by ground vegetation. Number in parentheses is the number of traps in the area.
Page created: July 16, 2010
Page updated: July 16, 2010
Page reviewed: July 16, 2010
The conclusions, findings, and opinions expressed by authors contributing to this journal do not necessarily reflect the official position of the U.S. Department of Health and Human Services, the Public Health Service, the Centers for Disease Control and Prevention, or the authors' affiliated institutions. Use of trade names is for identification only and does not imply endorsement by any of the groups named above.