Skip directly to site content Skip directly to page options Skip directly to A-Z link Skip directly to A-Z link Skip directly to A-Z link
Volume 13, Number 9—September 2007
Research

Frequent Travelers and Rate of Spread of Epidemics

T. Déirdre Hollingsworth*Comments to Author , Neil M. Ferguson*, and Roy M. Anderson*
Author affiliations: *Imperial College London, London, United Kingdom;

Main Article

Figure 2

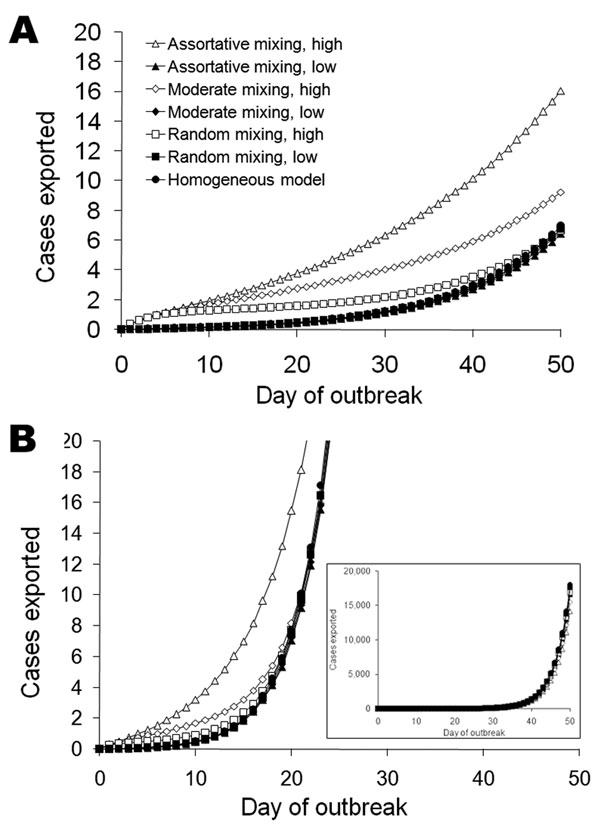
Mean number of cases exported from a single simulated source epidemic for severe acute respiratory syndrome–like parameters (A) and influenza-like parameters (B) (50,000 runs; parameters are listed in Table 1). Results are shown for a population in which everyone travels equally frequently (homogeneous model, circles), for a population in which 1% travel 20 times more frequently than the rest of the population, and for the 2 populations mixed randomly (φ = 1, squares) for moderate levels of mixing between the groups (φ = 0.5, diamonds) and for low levels of mixing in which most contacts are assortative (φ = 0.25, triangles). The first cases are either in the majority population of low-frequency fliers (solid symbols) or high-frequency fliers (open symbols). Inset in B shows a greater range on the y-axis. Variability about these means is shown in Table 2 and Appendix Figure 1.

Figure 2. Mean number of cases exported from a single simulated source epidemic for severe acute respiratory syndrome–like parameters (A) and influenza-like parameters (B) (50,000 runs; parameters are listed in Table 1). Results are shown for a population in which everyone travels equally frequently (homogeneous model, circles), for a population in which 1% travel 20 times more frequently than the rest of the population, and for the 2 populations mixed randomly (φ = 1, squares) for moderate levels of mixing between the groups (φ = 0.5, diamonds) and for low levels of mixing in which most contacts are assortative (φ = 0.25, triangles). The first cases are either in the majority population of low-frequency fliers (solid symbols) or high-frequency fliers (open symbols). Inset in B shows a greater range on the y-axis. Variability about these means is shown in Table 2 and Appendix Figure 1.

Main Article

Page created: July 01, 2010
Page updated: July 01, 2010
Page reviewed: July 01, 2010
The conclusions, findings, and opinions expressed by authors contributing to this journal do not necessarily reflect the official position of the U.S. Department of Health and Human Services, the Public Health Service, the Centers for Disease Control and Prevention, or the authors' affiliated institutions. Use of trade names is for identification only and does not imply endorsement by any of the groups named above.
file_external