Volume 15, Number 4—April 2009
Dispatch
Genetic Diversity of Toscana Virus
Ximena Collao12, Gustavo Palacios1, Sara Sanbonmatsu-Gámez, Mercedes Pérez-Ruiz, Ana I. Negredo, José-María Navarro-Marí, Marc Grandadam, Ana Maria Aransay, W. Ian Lipkin, Antonio Tenorio3, and María-Paz Sánchez-Seco3
Figure 1
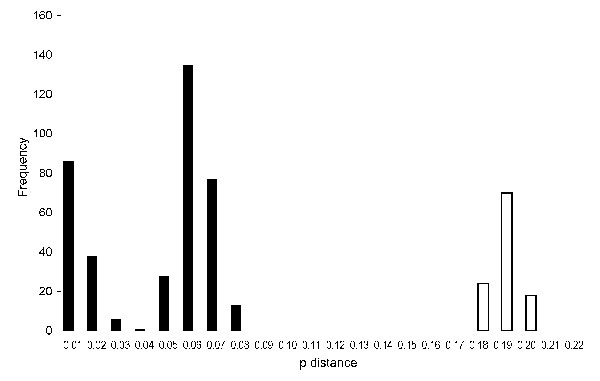
Figure 1. Histogram showing distribution of nucleotide pairwise (p) distances in the medium segment of Toscana virus. p distances are for nucleotides; frequencies are for intervals of 0.01. Validity of this method was confirmed by analysis of variance, comparing the scores of sequence comparisons within genotypes to those between genotypes. Black bars indicate intralineage distribution; white bars indicate interlineage distribution.
1,3These pairs of authors contributed equally to this work
2Current affiliation: Valparaíso University, Valparaíso, Chile
Page created: December 10, 2010
Page updated: December 10, 2010
Page reviewed: December 10, 2010
The conclusions, findings, and opinions expressed by authors contributing to this journal do not necessarily reflect the official position of the U.S. Department of Health and Human Services, the Public Health Service, the Centers for Disease Control and Prevention, or the authors' affiliated institutions. Use of trade names is for identification only and does not imply endorsement by any of the groups named above.