Volume 22, Number 12—December 2016
Research
Anomalous High Rainfall and Soil Saturation as Combined Risk Indicator of Rift Valley Fever Outbreaks, South Africa, 2008–2011
Figure 4
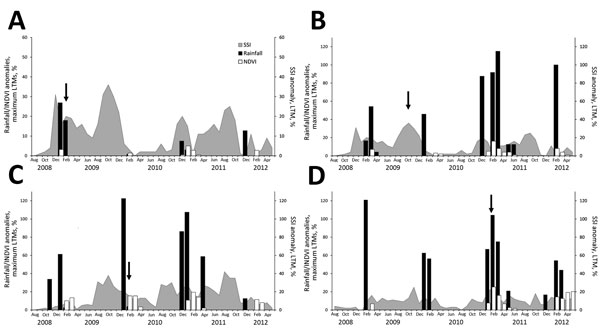
Figure 4. Comparison of monthly rainfall amounts, normalized difference vegetation indices (NDVIs), and soil saturation indices (SSIs) for August 2008–May 2012 for the following 4 areas of South Africa where Rift Valley fever epidemics occurred: A) Southern region of KwaZulu-Natal Province (outbreaks in February–March 2009); B) Orange River region in Northern Cape Province (outbreaks in October–November 2009); C) Bultfontein area of Free State Province (outbreaks in January–February 2010); D) Graaff-Reinet area of Eastern Cape Province (outbreaks in January–February 2011). Rainfall and NDVI anomalies were computed as percentage of the maximum of the long-term means (LTMs); SSI anomalies were computed as percentage of the LTM. Arrows indicate time of first outbreak in the region.