Volume 22, Number 12—December 2016
Research
Anomalous High Rainfall and Soil Saturation as Combined Risk Indicator of Rift Valley Fever Outbreaks, South Africa, 2008–2011
Roy Williams , Johan Malherbe, Harold Weepener, Phelix Majiwa, and Robert Swanepoel
Figure 8
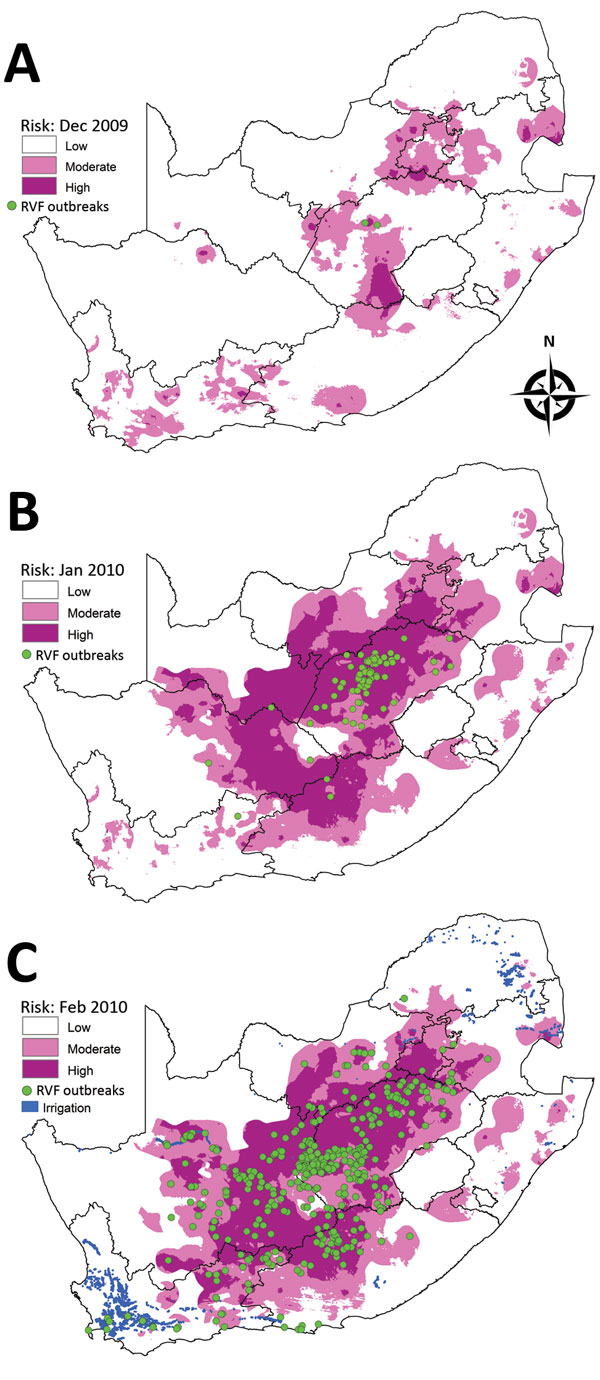
Figure 8. Risk maps for probability of Rift Valley fever (RVF) outbreaks in different areas of South Africa. A) Map for December 2009 showing subsequent outbreaks in January 2010. B) Map for January 2010 showing subsequent outbreaks in February 2010. C) Map for February 2010 indicating irrigation areas and subsequent outbreaks during March–June 2010.
Page created: November 17, 2016
Page updated: November 17, 2016
Page reviewed: November 17, 2016
The conclusions, findings, and opinions expressed by authors contributing to this journal do not necessarily reflect the official position of the U.S. Department of Health and Human Services, the Public Health Service, the Centers for Disease Control and Prevention, or the authors' affiliated institutions. Use of trade names is for identification only and does not imply endorsement by any of the groups named above.