Volume 23, Number 2—February 2017
Research
Correlation of West Nile Virus Incidence in Donated Blood with West Nile Neuroinvasive Disease Rates, United States, 2010–2012
Edouard Betsem, Zhanna Kaidarova, Susan L. Stramer, Beth Shaz, Merlyn Sayers, German LeParc, Brian S. Custer, Michael P. Busch , and Edward L. Murphy
Figure 1
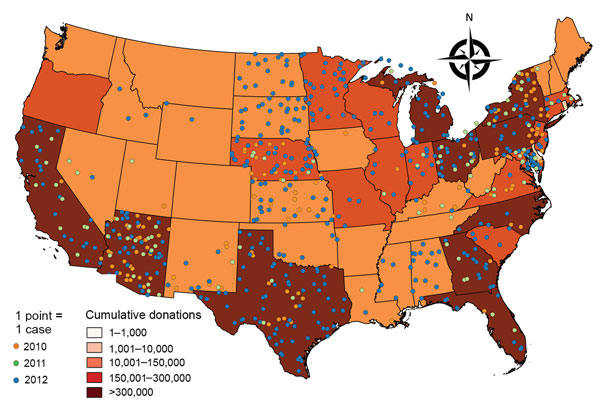
Figure 1. Geographic distribution of blood donations confirmed positive for West Nile virus (WNV) RNA, United States, June–October 2010–2012. The 640 confirmed WNV DNA–positive donations are represented by dots. Shading indicates cumulative number of donations for 2010–2012, by state, for catchment areas of >1,000 donations.
Page created: January 17, 2017
Page updated: January 17, 2017
Page reviewed: January 17, 2017
The conclusions, findings, and opinions expressed by authors contributing to this journal do not necessarily reflect the official position of the U.S. Department of Health and Human Services, the Public Health Service, the Centers for Disease Control and Prevention, or the authors' affiliated institutions. Use of trade names is for identification only and does not imply endorsement by any of the groups named above.