Volume 23, Number 2—February 2017
Research
Correlation of West Nile Virus Incidence in Donated Blood with West Nile Neuroinvasive Disease Rates, United States, 2010–2012
Edouard Betsem, Zhanna Kaidarova, Susan L. Stramer, Beth Shaz, Merlyn Sayers, German LeParc, Brian S. Custer, Michael P. Busch , and Edward L. Murphy
Figure 2
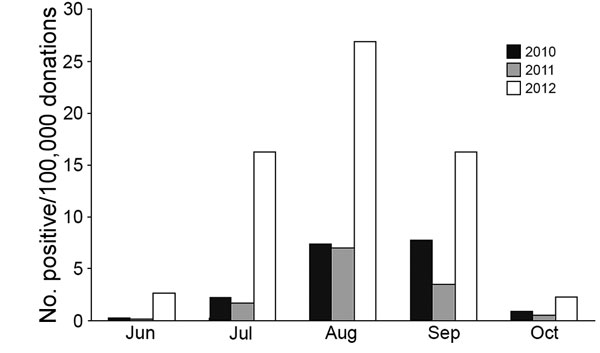
Figure 2. Rate of West Nile virus (WNV)–positive blood donations by month, United States, June–October 2010–2012. Overall, 640 WNV-positive donations were confirmed by nucleic acid testing in 10,107,853 screened donations. Positive donations collected during the months of January–May (1 in April 2010) and November–December (3 in November 2012) are not shown.
Page created: January 17, 2017
Page updated: January 17, 2017
Page reviewed: January 17, 2017
The conclusions, findings, and opinions expressed by authors contributing to this journal do not necessarily reflect the official position of the U.S. Department of Health and Human Services, the Public Health Service, the Centers for Disease Control and Prevention, or the authors' affiliated institutions. Use of trade names is for identification only and does not imply endorsement by any of the groups named above.