Volume 23, Number 4—April 2017
Research
Plasmodium malariae Prevalence and csp Gene Diversity, Kenya, 2014 and 2015
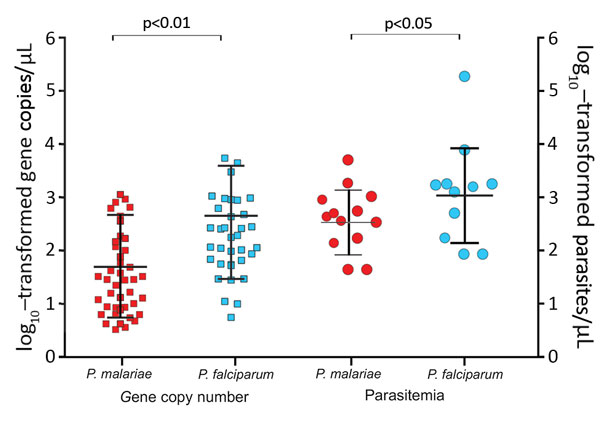
Figure 3

Figure 3. Plasmodium malariae and P. falciparum parasite gene copy numbers (per microliter) and parasitemia (parasites per microliter) in co-infected samples. Median, first quartile, and fourth quartile of the data are shown for each sample category (horizontal lines). Parasite gene copy number and parasitemia were lower in P. malariae–positive than in P. falciparum–positive samples. Squares represent samples with gene copy number measured by quantitative PCR; circles, samples with parasitemia estimated by microscopy; red, P. malariae samples; blue, P. falciparum samples.
Page created: March 16, 2017
Page updated: March 16, 2017
Page reviewed: March 16, 2017
The conclusions, findings, and opinions expressed by authors contributing to this journal do not necessarily reflect the official position of the U.S. Department of Health and Human Services, the Public Health Service, the Centers for Disease Control and Prevention, or the authors' affiliated institutions. Use of trade names is for identification only and does not imply endorsement by any of the groups named above.