Skip directly to site content Skip directly to page options Skip directly to A-Z link Skip directly to A-Z link Skip directly to A-Z link
Volume 23, Number 4—April 2017
Research

Plasmodium malariae Prevalence and csp Gene Diversity, Kenya, 2014 and 2015

Eugenia LoComments to Author , Kristie Nguyen, Jennifer Nguyen, Elizabeth Hemming-Schroeder, Jiaobao Xu, Harrisone Etemesi, Andrew Githeko, and Guiyun YanComments to Author 
Author affiliations: University of California Irvine, Irvine, California, USA (E. Lo, K. Nguyen, J. Nguyen, E. Hemming-Schroeder, G. Yan); Southern Medical University, Guangzhou, China (J. Xu); Kenya Medical Research Institute, Kisumu, Kenya (H. Etemesi, A. Githeko)

Main Article

Figure 4

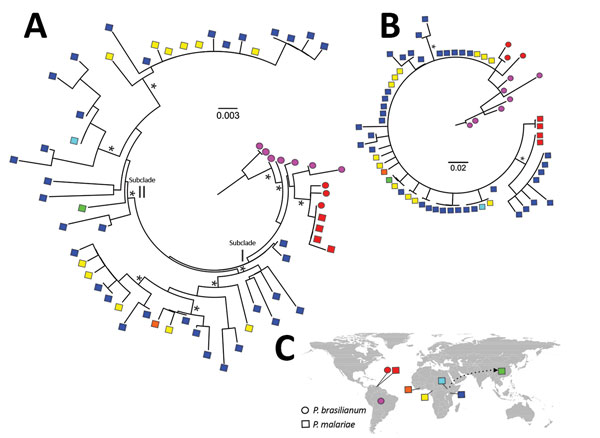
Maximum-likelihood analyses of circumsporozoite protein gene (csp) sequences of Plasmodium malariae and distribution of the samples. A) Phylogenetic tree based on maximum-likelihood analyses of the entire csp amino acid sequences of P. malariae isolates from different geographic regions, shown by different colors. Asterisks denote clade with >90% bootstrap support. Sequences of P. malariae from Venezuela (red squares) were almost identical to those of P. brasilianum (red circles) from the sam

Figure 4. Maximum-likelihood analyses of circumsporozoite protein gene (csp) sequences of Plasmodium malariae and distribution of the samples. A) Phylogenetic tree based on maximum-likelihood analyses of the entire csp amino acid sequences of P. malariae isolates from different geographic regions, shown by different colors. Asterisks denote clade with >90% bootstrap support. Sequences of P. malariae from Venezuela (red squares) were almost identical to those of P. brasilianum (red circles) from the same area. These samples were genetically closely related with P. brasilianum from Brazil (violet circles) but distant from P. malariae from East and West Africa. The samples from Africa were subdivided into 2 subclades, I and II. Subclade I comprised a mix of P. malariae isolates from Kenya (dark blue squares), Cameroon (yellow squares), and Côte d’ Ivoire (orange squares). Subclade II comprised a mix of P. malariae isolates from Kenya, Cameroon, Uganda (light blue squares), and China (green squares). B) Maximum-likelihood analyses of partial csp amino acid sequences without the central repeat region. P. brasilianum from Brazil was distant from P. malariae, but relationships among the P. malariae samples from different geographic areas were not well resolved. C) Locations of samples included in the analyses. Arrow indicates the possible African origin of P. malariae from China. Scale bars indicate length of phylogenetic tree. *Bootstrap value >90%.

Main Article

Page created: March 16, 2017
Page updated: March 16, 2017
Page reviewed: March 16, 2017
The conclusions, findings, and opinions expressed by authors contributing to this journal do not necessarily reflect the official position of the U.S. Department of Health and Human Services, the Public Health Service, the Centers for Disease Control and Prevention, or the authors' affiliated institutions. Use of trade names is for identification only and does not imply endorsement by any of the groups named above.
file_external