Volume 30, Number 11—November 2024
Research
Spatiotemporal Ecologic Analysis of COVID-19 Vaccination Coverage and Outcomes, Oklahoma, USA, February 2020–December 2021
Figure 2
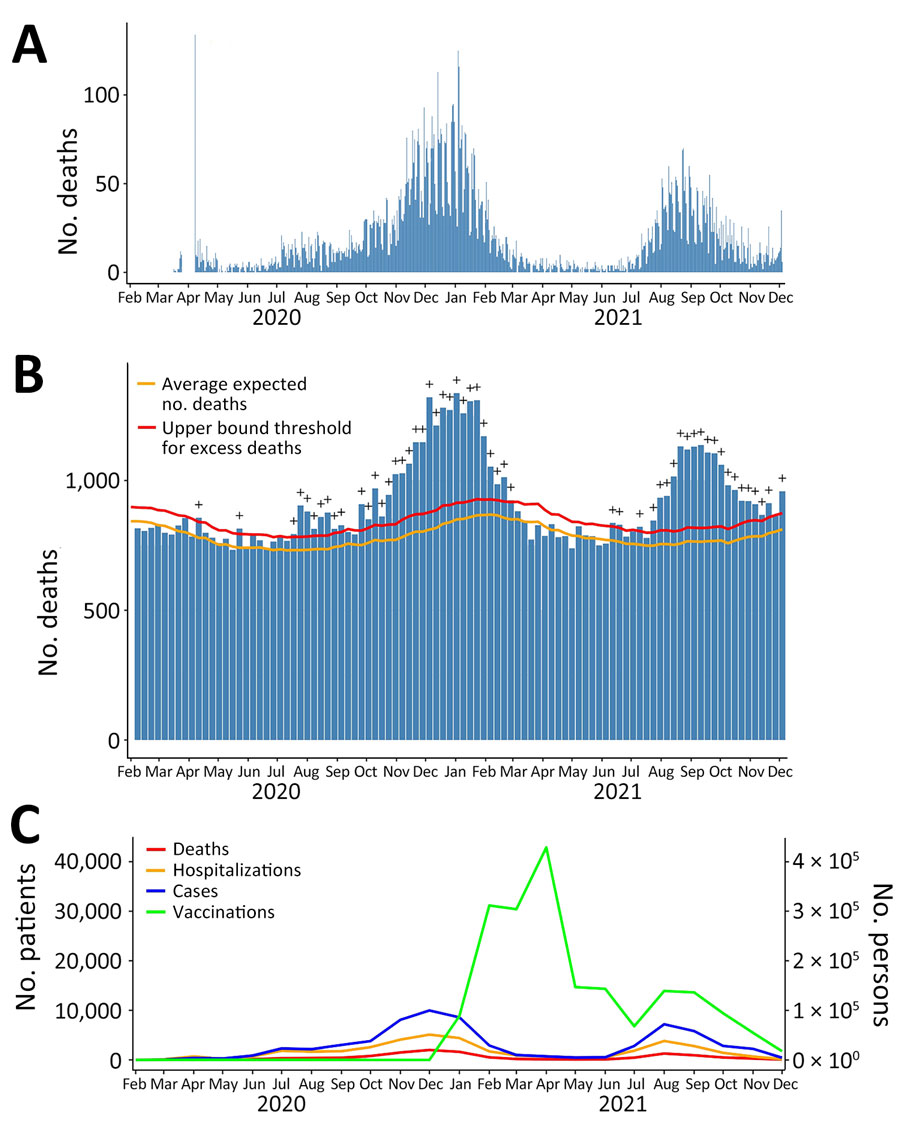
Figure 2. Distribution of COVID-19 deaths (A), all-cause and excess mortality (B), and COVID-19 cases, hospitalization, deaths, and rates of vaccination against COVID-19 (C) in analysis of COVID-19 vaccination coverage and outcomes, Oklahoma, USA, February 2020–December 2021. The spike in the number of deaths on April 8, 2020, was caused by the delay in death reporting early in the pandemic. The excess mortality plot was accessed from the Centers for Disease Control and Prevention National Center for Health Statistics and modified to reflect the study period February 2020–December 2021. Plus (+) symbol indicates observed count above threshold (defined as the upper bound of the 95% prediction interval of the expected number of deaths). In panel C, scales for the y-axes differ substantially to underscore patterns but do not permit direct comparisons. Data sources: https://covid.cdc.gov/covid-data-tracker; https://data.cdc.gov/Case-Surveillance/COVID-19-Case-Surveillance-Restricted-Access-Detai/mbd7-r32t