Volume 30, Number 11—November 2024
Research
Spatiotemporal Ecologic Analysis of COVID-19 Vaccination Coverage and Outcomes, Oklahoma, USA, February 2020–December 2021
Kai Ding , Ozair H. Naqvi, R. Jackson Seeberger, Dale W. Bratzler, and Aaron M. Wendelboe
Figure 3
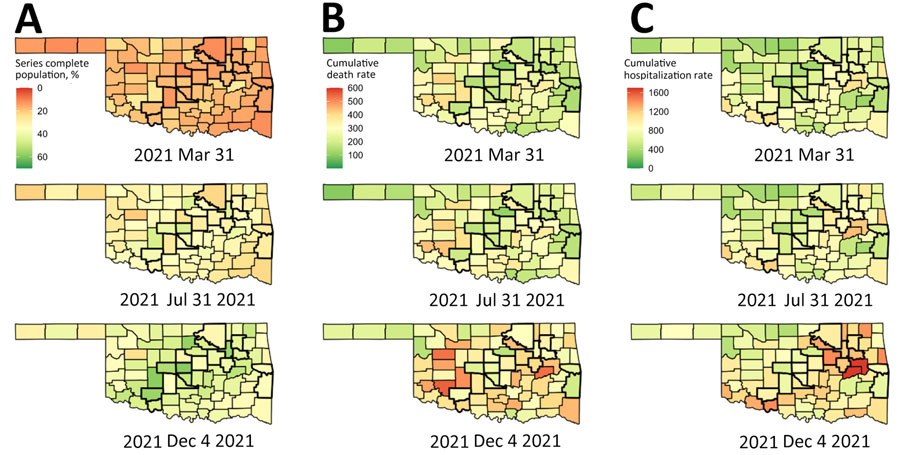
Figure 3. Spatial plots of county-level cumulative vaccination rates and cumulative death and hospitalization rates per 100,000 residents at selected time points in analysis of COVID-19 vaccination coverage and outcomes, Oklahoma, USA, February 2020–December 2021. A) Vaccination rates; B) death rates; C) hospitalization rates. Counties with thick boundary lines are metropolitan.
Page created: August 28, 2024
Page updated: October 22, 2024
Page reviewed: October 22, 2024
The conclusions, findings, and opinions expressed by authors contributing to this journal do not necessarily reflect the official position of the U.S. Department of Health and Human Services, the Public Health Service, the Centers for Disease Control and Prevention, or the authors' affiliated institutions. Use of trade names is for identification only and does not imply endorsement by any of the groups named above.