Volume 30, Number 2—February 2024
Dispatch
Power Law for Estimating Underdetection of Foodborne Disease Outbreaks, United States
Figure 1
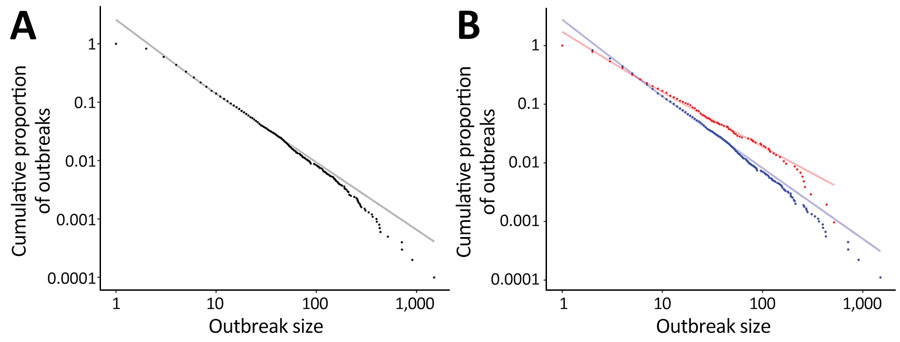
Figure 1. Log-log scale of foodborne outbreak size versus frequency from a power law for estimating underdetection of foodborne disease outbreaks, United States. A) Actual (black points) versus expected from the power law distribution (gray line) 1998–2017; B) actual (blue points) versus expected (light blue line) 1998–2019 and actual (red points) versus expected (light red line) 2018–2019. Estimates for the difference between the number of expected and actual small (<10 cases) and large (>100 cases) outbreaks were calculated by the sum of the differences between each of the relevant actual points and the expected line at the same x-value. Annual estimates were then calculated by dividing the number of years represented.
1These first authors contributed equally to this article.