Volume 30, Number 2—February 2024
Dispatch
Power Law for Estimating Underdetection of Foodborne Disease Outbreaks, United States
Laura Ford1 , Julie L. Self1, Karen K. Wong, Robert M. Hoekstra, Robert V. Tauxe, Erica Billig Rose, and Beau B. Bruce
Figure 2
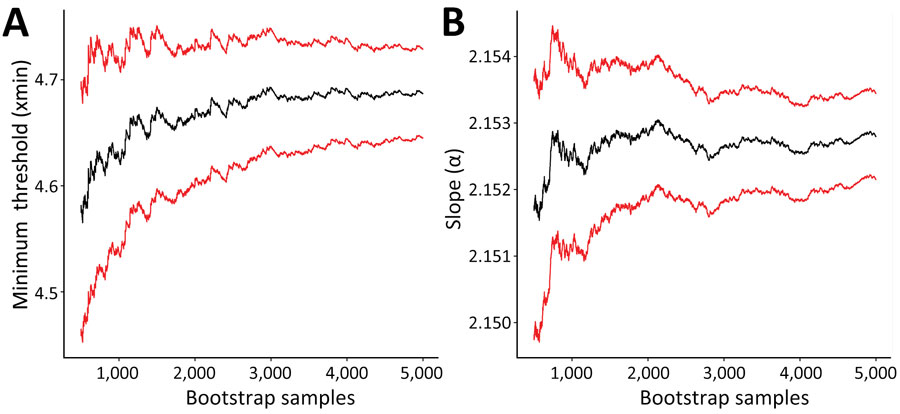
Figure 2. Parameter estimates from a power law for estimating underdetection of foodborne disease outbreaks, United States. Graphs display distribution of foodborne outbreak size and frequency for the minimum threshold (A) and slope (B) for outbreaks during 1998–2019. Black lines represent bootstrapped parameter estimate; red lines represent 90% credible intervals.
1These first authors contributed equally to this article.
Page created: December 31, 2023
Page updated: January 24, 2024
Page reviewed: January 24, 2024
The conclusions, findings, and opinions expressed by authors contributing to this journal do not necessarily reflect the official position of the U.S. Department of Health and Human Services, the Public Health Service, the Centers for Disease Control and Prevention, or the authors' affiliated institutions. Use of trade names is for identification only and does not imply endorsement by any of the groups named above.