Volume 30, Number 9—September 2024
Research
Effects of Rotavirus Vaccination Coverage among Infants on Hospital Admission for Gastroenteritis across All Age Groups, Japan, 2011–2019
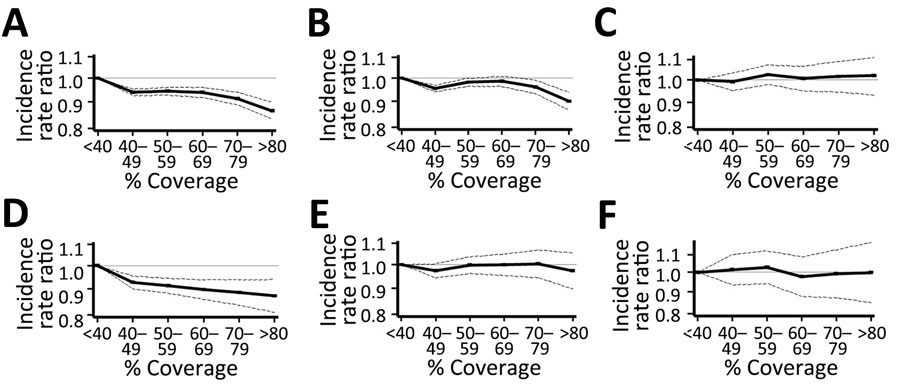
Figure 3

Figure 3. Association between vaccination coverage percentages and gastroenteritis hospitalization from generalized estimating equations analyses in study of effects of rotavirus vaccination coverage among infants on hospital admission for gastroenteritis across all age groups, Japan, 2011–2019. A–C) Annual associations for the overall population (A), the vaccination age-ineligible population (B), and immunocompromised persons (C). D–F) Associations during rotavirus epidemic seasons, February–April, for the overall population (D), vaccination age-ineligible population (E), and immunocompromised persons (F). Dashed lines indicate 95% CIs; gray horizontal lines indicate an incidence rate ratio of 1.0.
Page created: July 31, 2024
Page updated: August 20, 2024
Page reviewed: August 20, 2024
The conclusions, findings, and opinions expressed by authors contributing to this journal do not necessarily reflect the official position of the U.S. Department of Health and Human Services, the Public Health Service, the Centers for Disease Control and Prevention, or the authors' affiliated institutions. Use of trade names is for identification only and does not imply endorsement by any of the groups named above.