Skip directly to site content Skip directly to page options Skip directly to A-Z link Skip directly to A-Z link Skip directly to A-Z link

Disclaimer: Early release articles are not considered as final versions. Any changes will be reflected in the online version in the month the article is officially released.

Volume 31, Number 4—April 2025
Dispatch

Highly Pathogenic Avian Influenza A(H5N1) Virus Stability in Irradiated Raw Milk and Wastewater and on Surfaces, United States

Franziska Kaiser1, Santiago Cardenas1, Kwe Claude Yinda, Reshma K. Mukesh, Missiani Ochwoto, Shane Gallogly, Arthur Wickenhagen, Kyle Bibby, Emmie de Wit, Dylan Morris, James O. Lloyd-Smith, and Vincent J. MunsterComments to Author 
Author affiliation: National Institute of Allergy and Infectious Diseases, Hamilton, Montana, USA (F. Kaiser, K.C. Yinda, R.K. Mukesh, M. Ochwoto, S. Gallogly, A. Wickenhagen, E. de Wit, V.J. Munster); University of California, Los Angeles, California, USA (S. Cardenas, D. Morris, J.O. Lloyd-Smith); University of Notre Dame, Notre Dame, Indiana, USA (K. Bibby)

Main Article

Figure 2

Results of experimental testing of highly pathogenic avian influenza A(H5N1) virus stability on surfaces, United States. Surface stability of infectious H5N1 in milk at 4°C (blue) and 22°C (orange) was tested on polypropylene (A), stainless steel (B), and nitrile rubber material (C). Vertical lines represent random draws from the joint posterior distribution of the exponential decay rate and the initial virus titer, where the intercept of each line is the initial titer and the slope is the negative of the decay rate. The dashed horizontal lines are at 100.5 TCID50/mL of medium and represent the approximate limit of detection. Individual data points are represented as circles (above limit of detection) or triangles (below limit of detection). TCID50, 50% tissue culture infectious dose.

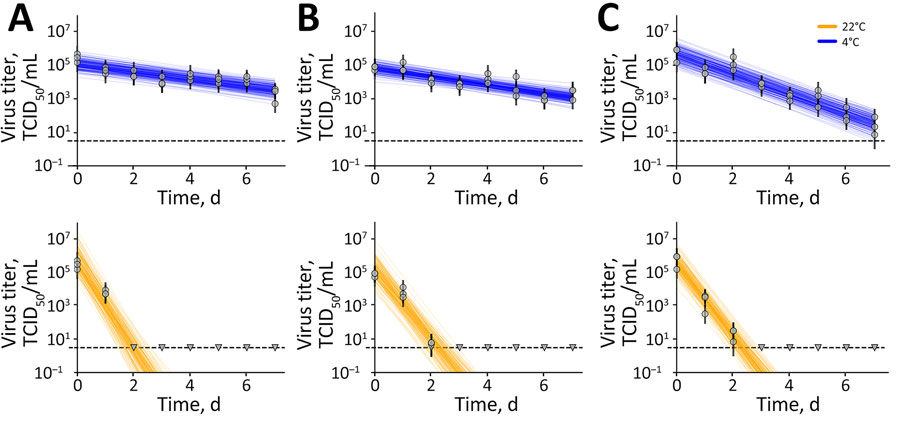
Figure 2. Results of experimental testing of highly pathogenic avian influenza A(H5N1) virus stability on surfaces, United States. Surface stability of infectious H5N1 in milk at 4°C (blue) and 22°C (orange) was tested on polypropylene (A), stainless steel (B), and nitrile rubber material (C). Vertical lines represent random draws from the joint posterior distribution of the exponential decay rate and the initial virus titer, where the intercept of each line is the initial titer and the slope is the negative of the decay rate. The dashed horizontal lines are at 100.5 TCID50/mL of medium and represent the approximate limit of detection. Individual data points are represented as circles (above limit of detection) or triangles (below limit of detection). TCID50, 50% tissue culture infectious dose.

Main Article

1These first authors contributed equally to this article.

Page created: March 03, 2025
Page updated: March 12, 2025
Page reviewed: March 12, 2025
The conclusions, findings, and opinions expressed by authors contributing to this journal do not necessarily reflect the official position of the U.S. Department of Health and Human Services, the Public Health Service, the Centers for Disease Control and Prevention, or the authors' affiliated institutions. Use of trade names is for identification only and does not imply endorsement by any of the groups named above.
file_external