Volume 29, Number 8—August 2023
Research
Prospecting for Zoonotic Pathogens by Using Targeted DNA Enrichment
Figure 4

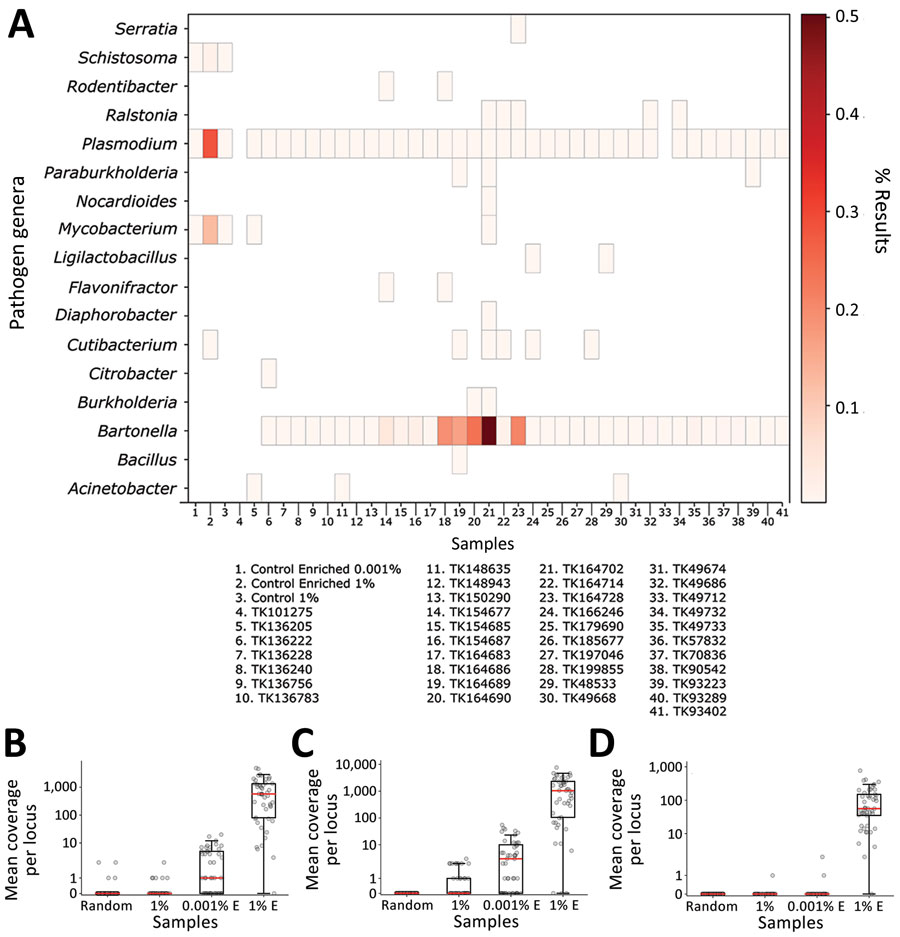
Figure 4. Identifying pathogen reads from controls and museum-archived tissue samples for study of prospecting for zoonotic pathogens by using targeted DNA enrichment. Control reads are indicated by the percentage of pathogen DNA 1% or 0.001%. A) Reads were compared with a database of target loci and assigned a taxonomic classification based on these results. Reads were assigned to 93 genera; of those, 17 (shown) were present in >1 sample, including controls, with ≥1,000 reads. A heatmap of those results shows the relative proportion of reads assigned to each genus. Details of samples are provided in Table 2. B–D) Coverage at each probed locus is shown across all control samples for Mycobacterium (B), Plasmodium (C), and Schistosoma (D). Each point in the chart is coverage calculated at a single target locus. Horizontal lines within boxes indicate medians, box tops and bottoms indicate lower and upper quartiles, and whiskers represent minimum and maximum values, excluding outliers. Each sample is indicated with a circle. E, enriched.