Lower Microscopy Sensitivity with Decreasing Malaria Prevalence in the Urban Amazon Region, Brazil, 2018–2021
Priscila T. Rodrigues, Igor C. Johansen, Winni A. Ladeia, Fabiana D. Esquivel, Rodrigo M. Corder, Juliana Tonini, Priscila R. Calil, Anderson R.J. Fernandes, Pablo S. Fontoura, Carlos E. Cavasini, Joseph M. Vinetz, Marcia C. Castro, Marcelo U. Ferreira

, and
on behalf of the Mâncio Lima Cohort Study Working Group1
Author affiliations: Centro Nacional de Pesquisa em Energia e Materiais, Campinas, Brazil (P.T. Rodrigues); University of São Paulo, São Paulo, Brazil (P.T. Rodrigues, I.C. Johansen, W.A. Ladeia, F.D. Esquivel, R.M. Corder; J. Tonini, P.R. Calil, A.R.J. Fernandes, P.S. Fontoura, M.U. Ferreira); State University of Campinas, Campinas (I.C. Johansen); Universidade Federal do ABC, Santo André, Brazil (J. Tonini); Instituto Federal de Educação, Ciência e Tecnologia de Minas Gerais, Belo Horizonte, Brazil (A.R.J. Fernandes); Ministry of Health, Brasília, Brazil (P.S. Fontoura); Faculdade de Medicina de São José do Rio Preto, São José do Rio Preto, Brazil (C.E. Cavasini); Yale School of Medicine, New Haven, Connecticut, USA (J.M. Vinetz); Universidad Peruana Cayetano Heredia, Lima, Peru (J.M. Vinetz); Harvard T.H. Chan School of Public Health, Boston, Massachusetts, USA (M.C. Castro); Global Health and Tropical Medicine, NOVA University of Lisbon, Lisbon, Portugal (M.U. Ferreira); Institute of Hygiene and Tropical Medicine, NOVA University of Lisbon (M.U. Ferreira)
Main Article
Figure 2
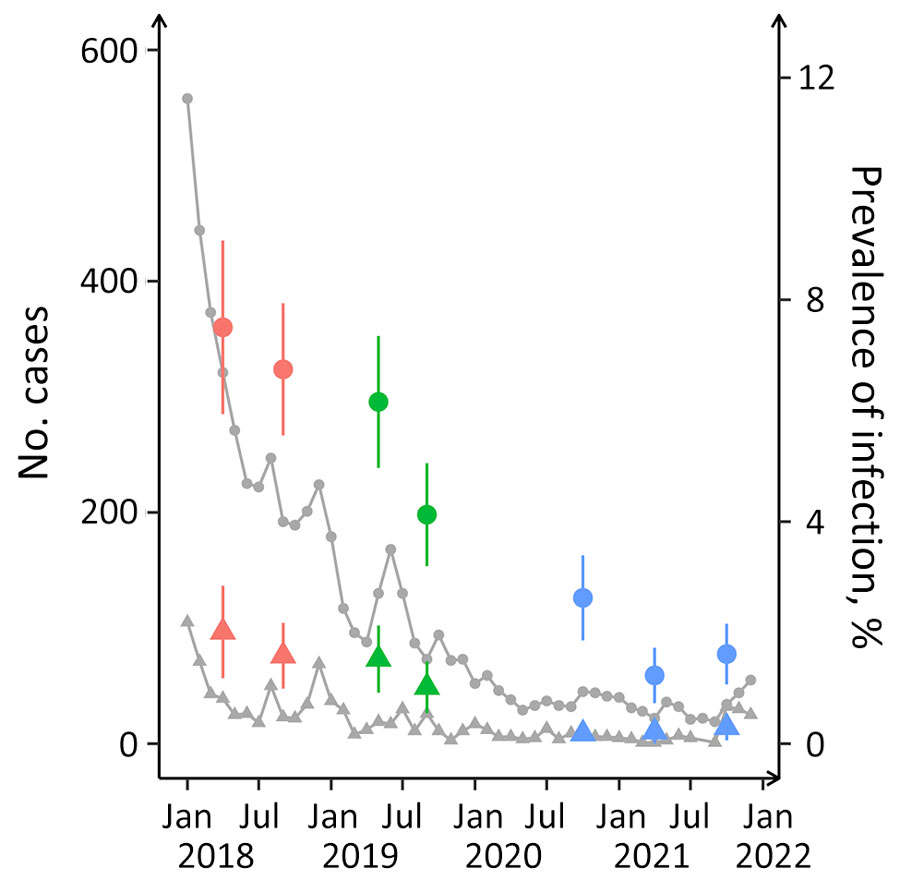
Figure 2. Monthly counts of microscopy-confirmed cases and percentages of infections diagnosed by PCR for Plasmodium vivax and P. falciparum in study of microscopy sensitivity and decreased malaria prevalence in the urban Amazon Region, Brazil, January 2018–December 2021. Circles indicate Plasmodium vivax and triangles P. falciparum. Red circles and triangles represent study waves 1 (April‒May 2018) and 2 (September‒October 2018); green, waves 3 (May‒June 2019) and 4 (September‒October 2019); blue, waves 5 (October‒November 2020), 6 (April‒May 2021), and 7 (October‒November 2021). Error bars indicate 95% CIs for prevalence rates. Anonymized malaria case notifications were downloaded from the electronic database of the Ministry of Health of Brazil (http://200.214.130.44/sivep_malaria)
Main Article
Page created: August 01, 2024
Page updated: August 20, 2024
Page reviewed: August 20, 2024
The conclusions, findings, and opinions expressed by authors contributing to this journal do not necessarily reflect the official position of the U.S. Department of Health and Human Services, the Public Health Service, the Centers for Disease Control and Prevention, or the authors' affiliated institutions. Use of trade names is for identification only and does not imply endorsement by any of the groups named above.