Skip directly to site content Skip directly to page options Skip directly to A-Z link Skip directly to A-Z link Skip directly to A-Z link
Volume 30, Number 9—September 2024
Research

Lower Microscopy Sensitivity with Decreasing Malaria Prevalence in the Urban Amazon Region, Brazil, 2018–2021

Priscila T. Rodrigues, Igor C. Johansen, Winni A. Ladeia, Fabiana D. Esquivel, Rodrigo M. Corder, Juliana Tonini, Priscila R. Calil, Anderson R.J. Fernandes, Pablo S. Fontoura, Carlos E. Cavasini, Joseph M. Vinetz, Marcia C. Castro, Marcelo U. FerreiraComments to Author , and on behalf of the Mâncio Lima Cohort Study Working Group1
Author affiliations: Centro Nacional de Pesquisa em Energia e Materiais, Campinas, Brazil (P.T. Rodrigues); University of São Paulo, São Paulo, Brazil (P.T. Rodrigues, I.C. Johansen, W.A. Ladeia, F.D. Esquivel, R.M. Corder; J. Tonini, P.R. Calil, A.R.J. Fernandes, P.S. Fontoura, M.U. Ferreira); State University of Campinas, Campinas (I.C. Johansen); Universidade Federal do ABC, Santo André, Brazil (J. Tonini); Instituto Federal de Educação, Ciência e Tecnologia de Minas Gerais, Belo Horizonte, Brazil (A.R.J. Fernandes); Ministry of Health, Brasília, Brazil (P.S. Fontoura); Faculdade de Medicina de São José do Rio Preto, São José do Rio Preto, Brazil (C.E. Cavasini); Yale School of Medicine, New Haven, Connecticut, USA (J.M. Vinetz); Universidad Peruana Cayetano Heredia, Lima, Peru (J.M. Vinetz); Harvard T.H. Chan School of Public Health, Boston, Massachusetts, USA (M.C. Castro); Global Health and Tropical Medicine, NOVA University of Lisbon, Lisbon, Portugal (M.U. Ferreira); Institute of Hygiene and Tropical Medicine, NOVA University of Lisbon (M.U. Ferreira)

Main Article

Figure 4

Minimal spanning trees representing the connectivity of Plasmodium vivax haplotypes from the Juruá Valley region of Brazil (264 isolates collected 2016‒2021). Circles represent haplotypes with size linearly proportional to the number of isolates sharing them. Lines connect pairs of haplotypes with <5 allele mismatches and the overall network represents the most likely haplotype genealogy, ensuring that the summed distance of all links of the tree is the minimum possible. Haplotype colors indicate the likely site of infection (Appendix Figure 2). The circle with blue and red slices indicates a haplotype that was shared by 2 parasites from different (urban and rural) origins.

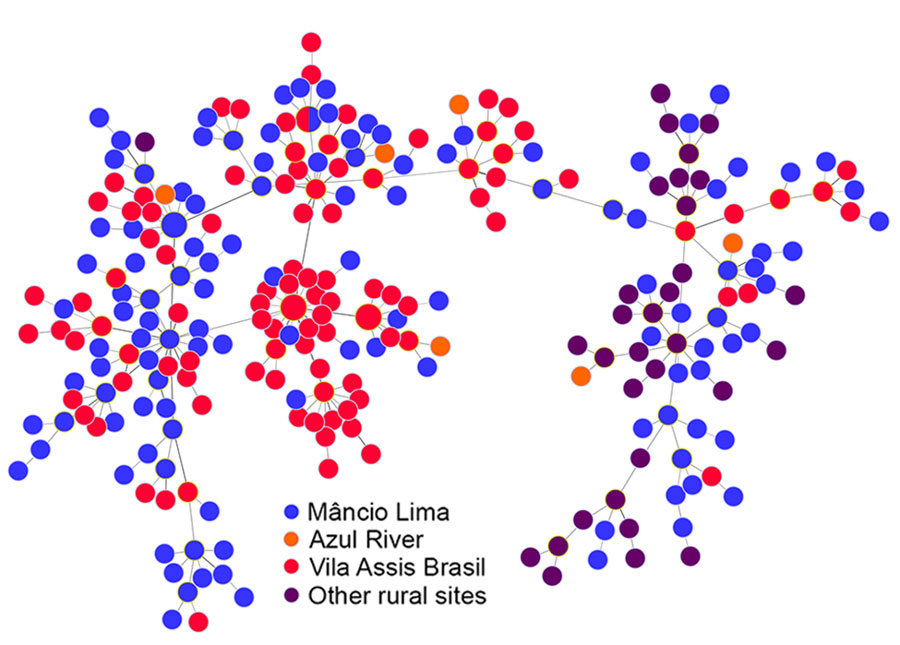
Figure 4. Minimal spanning trees representing the connectivity of Plasmodium vivax haplotypes from the Juruá Valley region of Brazil (264 isolates collected 2016‒2021). Circles represent haplotypes with size linearly proportional to the number of isolates sharing them. Lines connect pairs of haplotypes with <5 allele mismatches and the overall network represents the most likely haplotype genealogy, ensuring that the summed distance of all links of the tree is the minimum possible. Haplotype colors indicate the likely site of infection (Appendix Figure 2). The circle with blue and red slices indicates a haplotype that was shared by 2 parasites from different (urban and rural) origins.

Main Article

1Group members are listed at the end of this article.

Page created: August 01, 2024
Page updated: August 20, 2024
Page reviewed: August 20, 2024
The conclusions, findings, and opinions expressed by authors contributing to this journal do not necessarily reflect the official position of the U.S. Department of Health and Human Services, the Public Health Service, the Centers for Disease Control and Prevention, or the authors' affiliated institutions. Use of trade names is for identification only and does not imply endorsement by any of the groups named above.
file_external