Skip directly to site content Skip directly to page options Skip directly to A-Z link Skip directly to A-Z link Skip directly to A-Z link

Disclaimer: Early release articles are not considered as final versions. Any changes will be reflected in the online version in the month the article is officially released.

Volume 31, Number 5—May 2025
Research

Highly Pathogenic Avian Influenza A(H5N1) Outbreak in Endangered Cranes, Izumi Plain, Japan, 2022–23

Mana Esaki1, Kosuke Okuya1, Kaori Tokorozaki, Yuko Haraguchi, Taichi Hasegawa, and Makoto OzawaComments to Author 
Author affiliation: Kagoshima University, Kagoshima, Japan (M. Esaki, K. Okuya, M. Ozawa); Crane Park Izumi, Kagoshima, Japan (K. Tokorozaki, Y. Haraguchi); Matsuoka Research Institute for Science, Tokyo, Japan (T. Hasegawa)

Main Article

Figure 3

Box-and-whisker plot showing the distribution of copy numbers of the avian influenza virus (AIV) matrix (M) gene in swabs from AIV gene–positive cranes from the 2022–23 winter season compared with the combined 2020–21 and 2021–22 seasons in the Izumi Plain, Japan. We used RNA extracted from each AIV gene–positive swab sample for quantifying the copy number of the AIV M gene using real-time reverse transcription PCR. Boxes represent interquartile ranges; horizontal lines inside boxes indicates median; whiskers indicate maximum and minimum values. We evaluated significant differences between groups by paired t-test; p<0.05 was considered statistically significant.

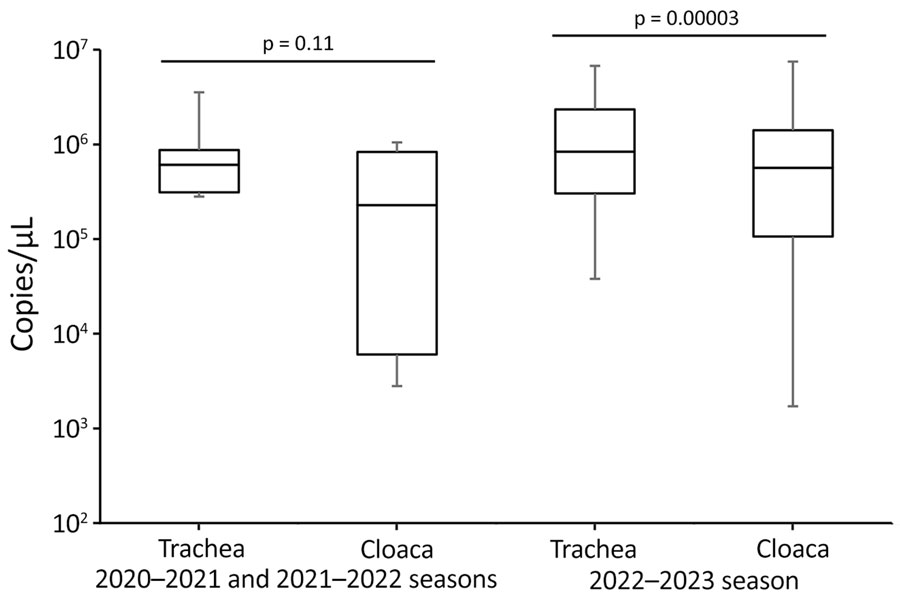
Figure 3. Box-and-whisker plot showing the distribution of copy numbers of the avian influenza virus (AIV) matrix (M) gene in swabs from AIV gene–positive cranes from the 2022–23 winter season compared with the combined 2020–21 and 2021–22 seasons in the Izumi Plain, Japan. We used RNA extracted from each AIV gene–positive swab sample for quantifying the copy number of the AIV M gene using real-time reverse transcription PCR. Boxes represent interquartile ranges; horizontal lines inside boxes indicates median; whiskers indicate maximum and minimum values. We evaluated significant differences between groups by paired t-test; p<0.05 was considered statistically significant.

Main Article

1These authors contributed equally to this article.

Page created: March 25, 2025
Page updated: April 14, 2025
Page reviewed: April 14, 2025
The conclusions, findings, and opinions expressed by authors contributing to this journal do not necessarily reflect the official position of the U.S. Department of Health and Human Services, the Public Health Service, the Centers for Disease Control and Prevention, or the authors' affiliated institutions. Use of trade names is for identification only and does not imply endorsement by any of the groups named above.
file_external