Volume 9, Number 12—December 2003
Dispatch
Severe Acute Respiratory Syndrome Epidemic in Asia
Guofa Zhou* and Eugenia Lo*
Figure
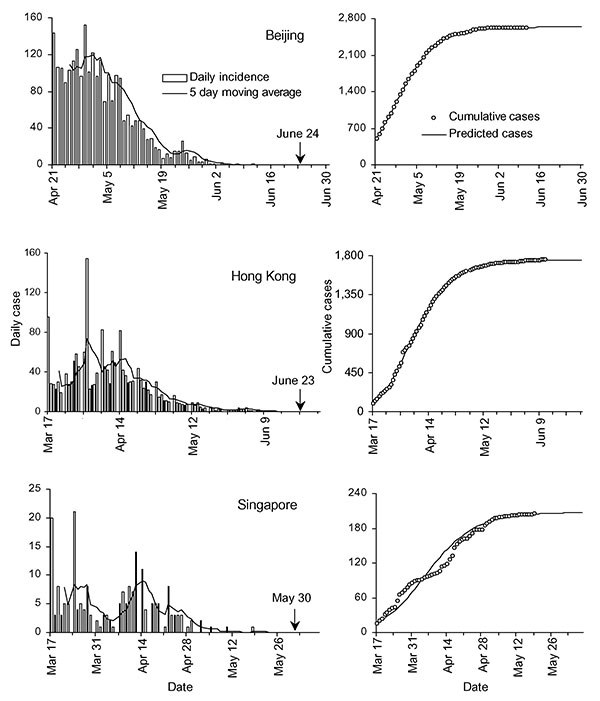
Figure. Epidemiologic depiction of epidemic of severe acute respiratory syndrome (SARS) in Beijing, Hong Kong, and Singapore. The number of daily confirmed SARS cases and 5-day moving average are represented by the left graphs. The observed and predicted cumulative cases since April 21, 2003 (Beijing), and March 17, 2003 (Hong Kong and Singapore), are shown in the right graphs. The modeling used case incidence data up to May 14, 2003. The arrow indicates the date that the World Health Organization removed the locality from the list of areas with local transmission.
Page created: March 16, 2011
Page updated: March 16, 2011
Page reviewed: March 16, 2011
The conclusions, findings, and opinions expressed by authors contributing to this journal do not necessarily reflect the official position of the U.S. Department of Health and Human Services, the Public Health Service, the Centers for Disease Control and Prevention, or the authors' affiliated institutions. Use of trade names is for identification only and does not imply endorsement by any of the groups named above.