Volume 26, Number 11—November 2020
Research
Modeling Treatment Strategies to Inform Yaws Eradication
Figure 5

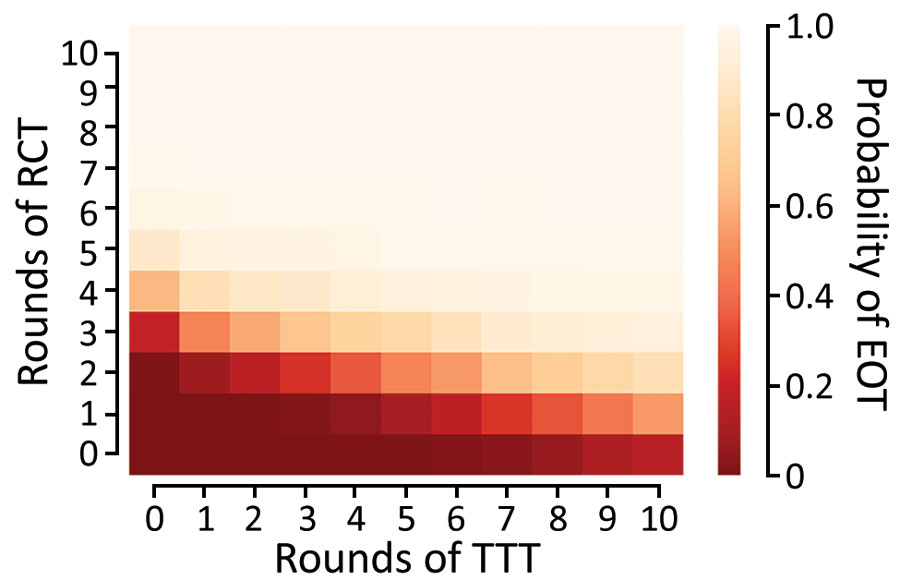
Figure 5. Probability of local elimination of transmission under different intervention strategies with varying numbers of rounds of TCT followed by rounds of TTT treating clinical case-patients and household contacts. Each rectangle in the figure represents a different strategy (consisting of some number of rounds of TCT followed by rounds of TTT). The color of the rectangle shows the probability of elimination of transmission, based on the color bar to the right. Each twice-yearly round of TCT has 80% coverage, whereas TTT has 100% coverage and treatment is assumed to have 95% efficacy. Parameters are inferred from data collected from the Solomon Islands in 2013. TCT, total community treatment; TTT, total targeted treatment.
Page created: August 18, 2020
Page updated: October 17, 2020
Page reviewed: October 17, 2020
The conclusions, findings, and opinions expressed by authors contributing to this journal do not necessarily reflect the official position of the U.S. Department of Health and Human Services, the Public Health Service, the Centers for Disease Control and Prevention, or the authors' affiliated institutions. Use of trade names is for identification only and does not imply endorsement by any of the groups named above.